Sugarcane

The South African sugar industry plans to transform and diversify sugar mills into bio-energy complexes that will produce ethanol and electricity, in addition to sugar. This case study investigates the potential of sugarcane field residue (brown leaves, stalk, mulch) and sugarcane mill residue (bagasse) to produce bioethanol.

 Authors: Keneilwe Hlahane, Marc Pienaar

Overview

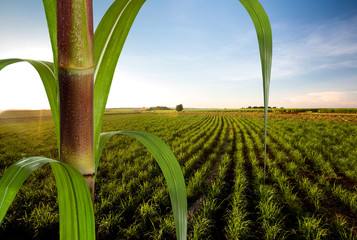
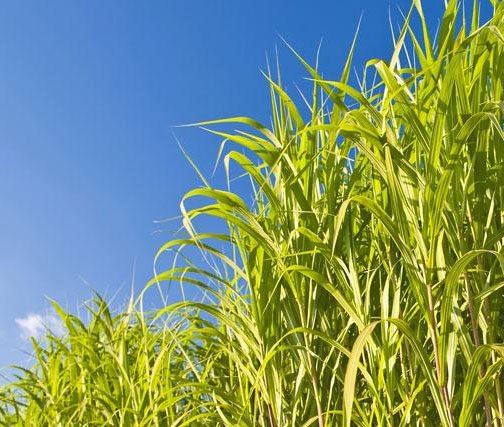
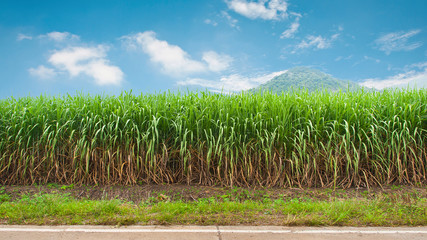
The South African sugar industry is one of the world’s top producers of high-quality sugar. The industry has 21 926 registered sugarcane growers who produce 20 million tonnes of sugarcane per year, according to 2019/2020 figures (SASA, 2020). South Africa has 14 sugar mills in operation operated by 6 milling companies. Farming and processing sugarcane in South Africa occurs in the northeastern parts of the country, primarily in Kwa-Zulu Natal, with some farming and milling occurring in Mpumalanga.

The sugar industry has been facing many challenges, such as increasing production costs and competing with cheap sugar imports. Additionally, the newly implemented government law on sugar tax has also led to a decrease in demand for sugar and a surplus in production. According to the South African Sugar Association (SASA) and South African Cane Growers Association (SACGA), the sugar industry experienced over a 30 percent decrease in the amount of sugar sold to the beverage sector since April 2018 (Sikuka, 2019). As a result, the sugar industry estimates that its revenue will drop by approximately R1.8 billion (SA Canegrowers, 2017). All these challenges are affecting the sugar industry’s return on sales.

The sugar industry has been exploring other manufacturing methods, such as diversification of the industry. Diversification of the sugar industry would transform sugar mills into bio-energy complexes that would produce ethanol and electricity in addition to sugar (Farzad et al., 2017). This plan of the sugar industry is in line with the South African government’s National Development Plan (NDP) (South African Government,2012), which seeks to grow the economy and create jobs by 2030. The plan aims to resolve the energy crisis, improve energy infrastructure and reduce carbon emissions by diversifying the energy mix. Internationally, countries such as Brazil, Thailand, and Australia have already diversified their sugar industries. 

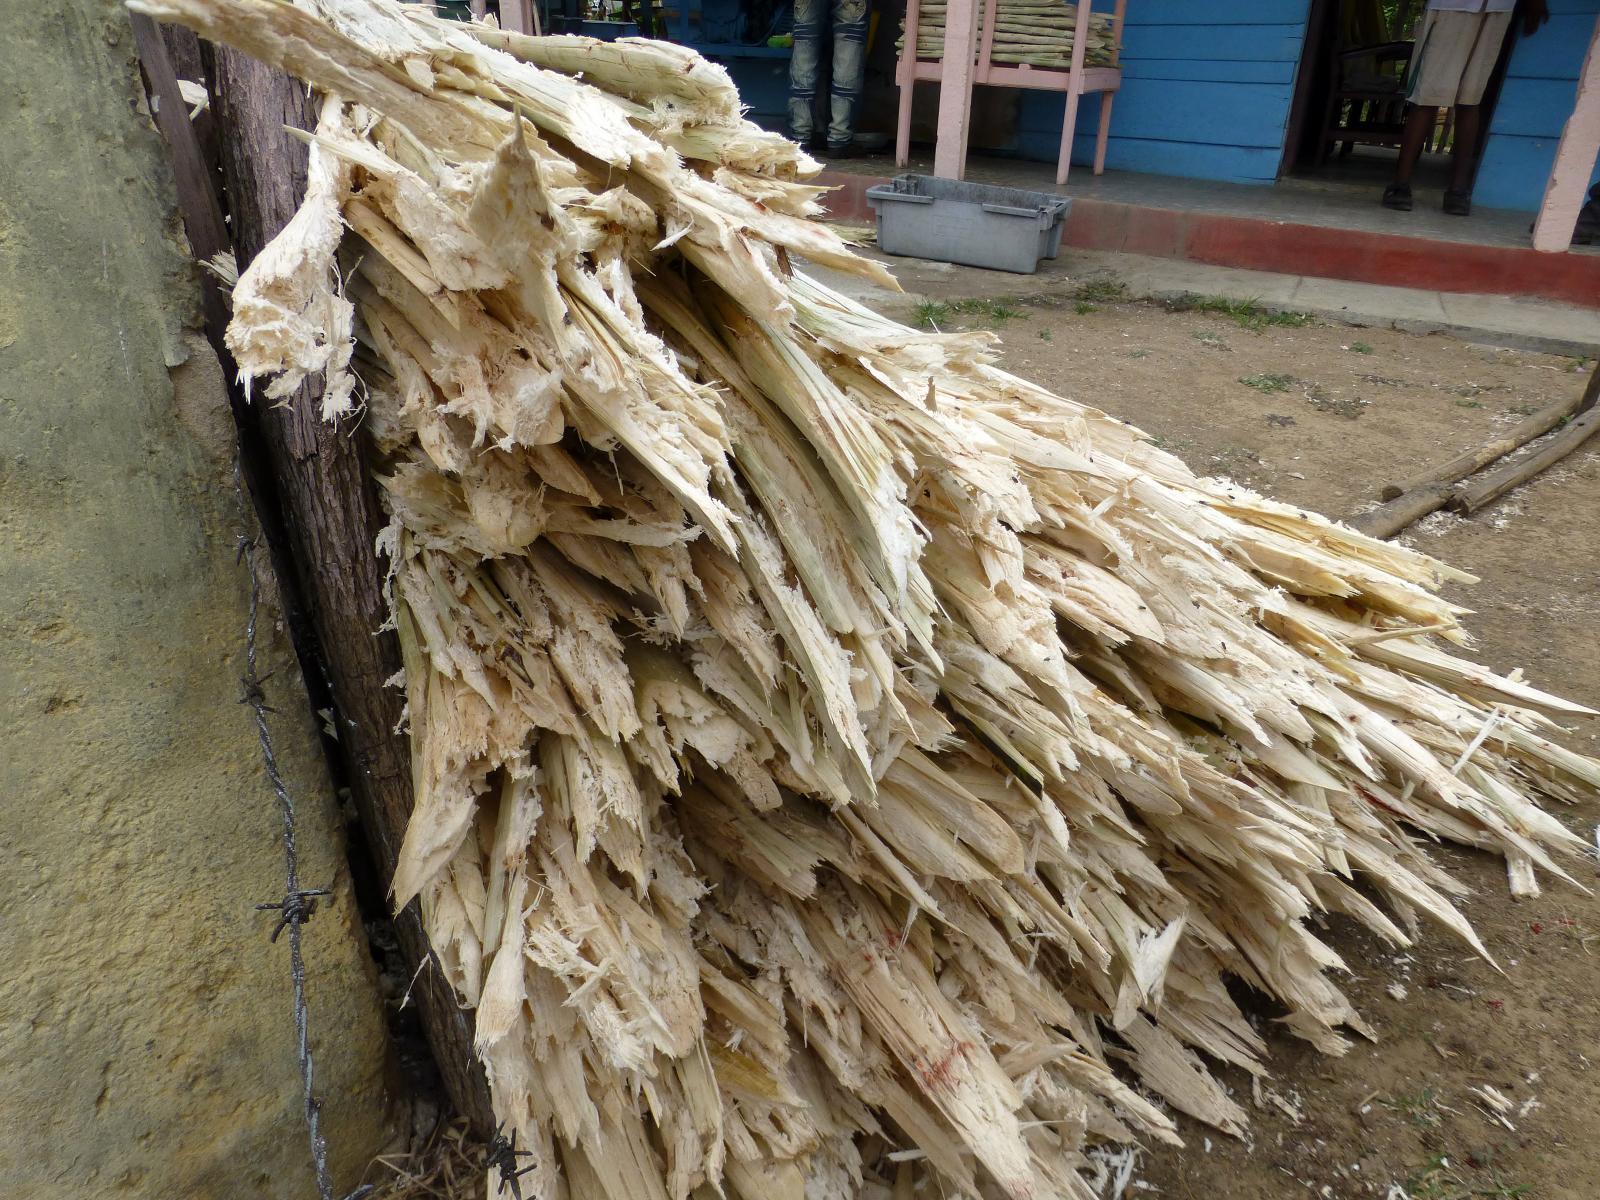
The sugarcane industry generates a large amount of lignocellulosic biomass derived from sugarcane, biomass consists of the residue that remains in the field after the sugarcane harvest, and the residue left after the milling process. The milling of sugarcane to extract the juice generates bagasse (the fibrous biomass remaining after stalks are crushed to extract the liquid), while field residue consists of stalk, mulch, and brown leaves. Lignocellulosic biomass can be used as feedstock to produce second-generation (2G) ethanol which can be used to replace or be mixed with petroleum fuels

This case study will investigate the techno-economic feasibility of using sugarcane field residue or mill residue as feedstock to produce ethanol and transport fuels. The techno-economic feasibility analysis for the study assesses conventional technologies with an end product of ethanol, diesel, or gasoline.

Available biomass feedstock

Sugarcane to ethanol production

Ethanol production from sugarcane

This case study focuses on second-generation (2G) bioethanol facilities that would process lignocellulose from the leaf material and bagasse to produce bioethanol. A summary of 2G ethanol production from lignocellulosic biomass involves the following steps (Pereira et al., 2015):

(1) Pre-treatment to liberate cellulose by removing lignin or hemicellulose.

(2) Depolymerisation of carbohydrate polymers to produce free sugars by cellulase-mediated action.

(3)Fermentation of hexose and/or pentose sugars for ethanol production.

(4) Distillation of the ethanol.

The are several process technologies that are used to convert lignocellulose into ethanol. The associated table summarises the process conversion technologies and bioenergy output.

Process technology Conversion technology Bioenergy output

Fermentation

Ethanol
Gasification
Diesel and gasoline
Fermentation
Ethanol
Gasification
Gasoline
Pyrolysis
Gasoline and diesel
Pyrolysis
Transport fuels
Pyrolysis
Transport fuels
Catalytic Conversion
Ethanol
Hydrocracking
Natural gas, diesel, aviatior

Techno-economic feasibility analysis

The techno-economic feasibility analysis for this case study determined optimal locations in Kwa-Zulu Natal province to place an ethanol or transport fuel-producing facility. The site allocation of the facility is based on the distribution and volumes of available feedstock.

The modeling process consisted of generating service regions for candidate facility locations, followed by ranking the sites based on the relative transport costs required for each candidate facility. Data regarding the number of facilities and the transport costs and distances per modeled facility location are presented below as cost summaries, transport distances, and facility spatial information.

Cost comparison per facility type

Comparisons of the unit cost of production for each technology and facility capacity used in this case study are presented below. A comparison between processing facility product output (ethanol and transport fuels) is shown between the two different feedstocks (bagasse and brown leaves). In each category tab, a unit cost of production is given per harvested tonne and processed tonne (left), and the corresponding cost/unit output (right) and the competitor range. All values are given in 2019 Rand equivalents. The competitor prices for ethanol come from the U.S. Grains Council 2019 ethanol cost reports (https://grains.org/ethanol_report/) and represent 2019 Rands equivalent costs for the Gulf, Pacific Northwest, and Brazil (the largest ethanol producers in the world combined). The competitor prices for transport fuels represent a range of fuel prices for petrol and diesel in 2019 Rand equivalents from the Department of Mineral Resources and Energy(http://www.energy.gov.za/files/media/Petroleum_Products.html)

In each figure, production costs (left) are the total costs estimated from the model and include the Capex and Opex of the conversion facility, as well as the transport costs and loading costs from feedstock locations to conversion facility (a more detailed costing of each category is given further down). Here, the production cost per processed tonne is dependent on the conversion efficiency of the processing technology (shown on the right-hand axis in the top row). The top row provides a more detailed comparison, while a range summary (per technology) is presented below.

In general, brown leaves have slightly higher expenses, mainly due to additional transport requirements from the sugarcane fields to a conversion facility. In both cases (bagasse and brown leaves), the cost of producing ethanol for these conversion technologies is much higher than the competitor range. The same is true for transport fuels, except for Hydropyrolysis (HPy) within the competitor range. Note that there was not enough brown leaves feedstock to meet some of the processing technologies capacity requirements for transport fuels.

Cost summaries per facility type

The charts below present detailed production costs for each conversion technology according to various cost categories (Capex, Opex, load costs, unloading costs, and transportation costs). The charts also present the costs per scenario (lifetime, average, and present value in 2019 Rands) in the top row and per facility in the bottom row. The total Rand value is given on the right-hand axis of each chart, with the cheapest production cost highlighted in bold.

Transport summaries per facility type

The transportation summaries below give details on the transportation requirements for each conversion technology. On the left are the ranges of distances required for each facility and transport mode (road and off-road). The mean distances per working day and year (per vehicle) are given. The total distances (for all vehicles) are summarised in the middle chart. Finally, the chart on the right provides the number of vehicles and facilities (these values are presented on the right-hand axis) for each conversion technology.

Transport distances and facility spatial information

The figures below present a detailed summary of the transportation distances for each of the conversion technologies used in this case study (for both bagasse and brown leaves), along with the location and routes from each feedstock location (including their catchment area) to the conversion facilities in each technology option. The road type attributes in the bar chart (top) are according to the attribute fields in South Africa’s National Geo-spatial Information (NGI) 2019 road layer (http://www.ngi.gov.za). The distances are given per road type in km/y and summarised as the total road, total off-road, and total distances that need to be travelled. Additional information and model assumptions are provided in the bottom image. These include the feedstock type; the total tonnes available from the feedstock per year (the minimum); the conversion technology and its processing capacity; the total distance that needs to be travelled; the number of road and off-road vehicles required (including assumptions about their cost per km, average travel speed, load capacity, and working days per year). The legend on the map provides further information on the number of facilities required for each scenario, the number of feedstock locations (roadside depots), and the number of catchments that supply the feedstock.

Bagasse

Brown leaves

Conclusions

The spatial logistical modeling platform developed for the BioEnergy Atlas of South Africa was utilized to develop scenarios for locations where ethanol-producing facilities can be built. Model outputs include spatial logistical information such as optimal biomass transportation routes from the biomass location to the modelled facility locations as well as cost summaries which include Capex, Opex and Transport costs.The modelled cost for each proposed facility location are compared to existing product market prices, allowing the price competitiveness for each location to be determined.

Model outputs show that the production cost (R /tonne) was above the competitor range for producing ethanol from bagasse and for producing transport fuels from bagasse, Hydropyrolysis (HPy) conversion technology production cost (R/t) was the only technology that was within the competitor range. The volume of biomass feedstock available annually is sufficient to support a maximum of 28 second-generation (2G) ethanol and transport fuel production facilities. 

The results of cost comparison of production costs showed that the production cost (R /tonne) was above the competitor range for producing ethanol from bagasse and for producing transport fuels from bagasse, Hydropyrolysis (HPy) conversion technology production cost (R/t) was the only technology that was below the competitor range. 

Data

Feedstock spatial information

Download the spatial information for sugarcane mill feedstock and  Brownfield field feedstock

Download feedstock spatial data

Feasibility Analysis Results

Download the results from the feasibility analysis

Download model outputs

Resources

Bibliography

  1. Farzad, S., Mandegari, M.A., Guo, M., Haigh, KF., Shah, N., Görgens,JF. 2017, Multi-product biorefineries from lignocelluloses: a pathway to the revitalization of the sugar industry, Biotechnology Biofuels 10<https://doi.org/10.1186/s13068-017-0761-9>
  2. Pereira, S.C., Maehara, L., Machado, C.M.M. 2015, ‘2G ethanol from the whole sugarcane lignocellulosic biomass’, Biotechnology for Biofuels volume 8, Article number 44. < https://doi.org/10.1186/s13068-015-0224-0 >
  3. SA canegrowers, 2017, ‘Cheap Imports sour SA’s sweet silver lining’, viewed 4 February 2021, < https://sacanegrowers.co.za/2020/11/17/cheap-imports-sour-sas-sweet-silver-lining/ >.
  4. Sikuka, W 2019, ‘South African Sugar Industry Crushed by Not So Sweet Tax’, Global Agricultural Information Network Grain Report, Number: SA1904. Available at https://www.fas.usda.gov/data/south-africa-south-african-sugar-industry-crushed-not-so-sweet-tax .(Accessed: 3 February 2021).
  5. South African Department of Mineral Resources and Energy (2021) Energy Statistics – Petroleum Products <http://www.energy.gov.za/files/media/Petroleum_Products.html>
  6. South African Sugar Association (SASA) 2020, Sugar industry statistical information, viewed 4 February 2021, <https://sasa.org.za/facts-and-figures/>.
  7. South African Government, 2012. The National Development Plan. p.218.
  8. Unites States Grain Council (2021) ETHANOL MARKET AND PRICING DATA <https://grains.org/ethanol_report/>