Modelling BioEnergy Feasibility

This section provides an overview of the process used in the BioEnergy Atlas to model the feasibility of bioenergy production in South Africa

Contents

Last updated: 03 May 2021 | Authors: Hayden Wilson, Marc Pienaar and Wim Hugo

Overview

The BioEnergy Atlas for South Africa was conceived as a knowledge repository to facilitate the establishment of a bioenergy industry within South Africa. To that end, the atlas provides information regarding the spatial availability of bioenergy feedstocks and an assessment of the suites of suitable technologies and products that are potentially feasible for bioenergy production in South Africa. This section describes the processes used to model the production costs of bioenergy products derived from a range of conversion technologies, enabling modelled costs to be compared to the costs of competing energy sources.

The feasibility of a conversion technology was determined by first calculating the total costs over the lifetime of the technology and then comparing the present value cost against competing technologies in 2019 Rands. Drivers for supply and demand may change over time, depending on the current global macroeconomic trends and factors such as societal transformation and urbanisation. Assessing the feasibility of capital investment in bioenergy conversion infrastructure requires that feasibility is tested for sensitivity to variations in the major assumptions, ranging from economic drivers (cost of capital, operational costs, inflation, energy costs) through to assumptions about demand and supply. Scenarios are a means of exploring these futures where significant uncertainty exists; here, a quasi-deterministic approach was followed to quantitatively understand the cost implications of each technology option under a range of factors.

Bioenergy conversion technologies

The BioEnergy Atlas of South Africa contains a repository of fact sheets describing the processes and considerations for several conversion technologies.

Bioenergy conversion technologies refer to the range of different industrial processes that convert recently living organic materials known as biomass into energy products such as transportation fuels, cooking fuels, heat, electricity, and other energy products.

Bioenergy conversion technologies can be broadly grouped into the following categories:

Chipping

Biomass chipping is a form of biomass pre-treatment that results in wood chips that can either be directly burned as a fuel source or used as a feedstock for other bioenergy conversion processes. Chipping consists of mechanically breaking down the biomass feedstock into smaller fragments, allowing for more efficient transportation and ease of material handling. (Johannson et al., 2006)

Direct combustion

Direct combustion is a process whereby woody waste or other solid fuel is combusted in the presence of excess oxygen in a boiler to produce steam for electricity production (typically in a fossil-fuel-fired power plant). It is one of the most common forms of bioenergy  (Bioenergy Resources and Technologies – energypedia.info, viewed 30 April  2021, <https://energypedia.info/wiki/Bioenergy_Resources_and_Technologies>).

Gasification

Gasification is the process of turning a solid fuel into a gas either chemically or through heat. For example, a woody feedstock is converted into synthesis gas or ‘syngas’ under high heat and limited oxygen, which can then be combusted in a boiler to produce steam for electricity or heat  (Bioenergy Resources and Technologies – energypedia.info, viewed 30 April  2021, <https://energypedia.info/wiki/Bioenergy_Resources_and_Technologies>).

Pelleting

Biomass pellets can be used in various applications ranging from domestic (e.g. household use) to industrial-scale applications (e.g. electric power plants).  The pellets are made from solid waste material such as forestry residue, woody waste,  and agricultural biomass. Pellet-making equipment is relatively cost-effective and available in various sizes and operational scales. There are different grades of pellets, but they all have low moisture content and high combustion efficiency with standardised shape and density for compact storage and easy transportation. (Biomass Pelletization Process | BioEnergy Consult, viewed 30 April  2021, https://www.bioenergyconsult.com/biomass-pelletization/>)

Pyrolysis

Pyrolysis is the thermal decomposition of organic matter in the absence of oxygen under high temperatures and pressure. The temperature determines the output product, as either gas, bio-oil, or charcoal (Bioenergy Resources and Technologies – energypedia.info, viewed 30 April  2021, <https://energypedia.info/wiki/Bioenergy_Resources_and_Technologies>).

Anaerobic digestion

Anaerobic digestion is the decomposition of organic matter by microorganisms in the absence of oxygen. The output product is a gaseous mixture of methane and carbon dioxide (CO2). The methane is used for electricity generation or heat (Bioenergy Resources and Technologies – energypedia.info, viewed 30 April  2021, <https://energypedia.info/wiki/Bioenergy_Resources_and_Technologies>).

Biochemical conversion

“Biochemical conversion technologies use a variety of high temperature, high pressure acid, enzymes, or other treatment techniques to break down the lignin and hemicellulose that surround the cellulose. Hydrolysis using enzymes and acids then breaks down the cellulose into sugar which in turn is fermented to produce ethanol” (Bioenergy Resources and Technologies – energypedia.info, viewed 30 April  2021, <https://energypedia.info/wiki/Bioenergy_Resources_and_Technologies>).

Bio-products

“Bio-based chemicals and materials can serve as renewable alternatives to many of the products derived from petroleum or natural gas, such as plastics, fertilizers, lubricants, and industrial chemicals. They also often require less energy during production and produce fewer greenhouse gases than their petroleum-based equivalents.


Manufacturing bioproducts from biomass involves a variety of industrial techniques. Many of these processes are similar to those used in the production of biofuels. Biomass is first broken down into relatively stable chemical building blocks, which are then converted into a wide range of marketable products using a combination of biological, thermal, and chemical processes.” (Bioproduct Basics | Department of Energy. Viewed 30 April  2021, https://www.energy.gov/eere/bioenergy/bioproduct-basics>)

Fermentation

“Starchy plants are often used in the biochemical fermentation process to convert sugars into alcohol. This is the most common process used to produce ethanol from corn and sugarcane” (Bioenergy Resources and Technologies – energypedia.info, viewed 30 April  2021, <https://energypedia.info/wiki/Bioenergy_Resources_and_Technologies>).

Transesterification

“Transesterification is a process that converts oils or fats into biodiesel. The process involves the removal of water and contaminants from the feedstock, the mixing with alcohol (typically methanol), and a catalyst (such as sodium hydroxide). Fatty acid methyl esters and glycerin are produced as byproducts of the process.” (Bioenergy Resources and Technologies – energypedia.info, viewed 30 April  2021, <https://energypedia.info/wiki/Bioenergy_Resources_and_Technologies>).

Costing bioenergy production

The process of harvesting and transporting biomass from the biomass production source to a conversion facility represents a significant portion of the total cost of production of a bioenergy product. As such, harvest and transportation costs are estimated according to the following activities:

    • Harvesting– Is a process involving the gathering and removal of the biomass from the field, which also depends upon the types of biomass that are being harvested (Searcy et al., 2007).
    • Haulage– transporting or moving the biomass either by truck or truck-connected trailer (on-road) or tractor and trailer combination (off-road).
    • Loading – the biomass load being placed into the truck for haulage.
    • Unloading – removing the biomass load from the truck.

The costs for the above are dependent on the types of feedstock that are being considered and have their specific parameters such as cost per tonne, machine operational rates, machine capacity, and the number of machine operators, to name a few.

The effect of scale of production on bioenergy unit cost

The BioEnergy Atlas utilises an advanced spatial logistical model (the model) to derive transportation costs and determine the optimal locations for bioenergy production facilities. 

The model was developed to allow for the optimal siting of bioenergy production facilities according to the expected volume of a bioenergy feedstock that the facility will process during a specified period. Production facilities requiring larger feedstock volumes typically have higher initial capital costs and will need to source their feedstock from larger regions. Consequently, they will have higher transportation costs. Conversely, larger facilities typically have better economies of scale and are thus capable of producing a bioenergy product at higher efficiencies at a lower unit cost of production than smaller facilities.  

Accurate transport cost modelling is thus an essential component of assessing the feasibility of Bioenergy production. It is entirely related to the spatial distribution of biomass feedstock and the proximity of that feedstock to a road network.

Chart 1: Theoretical example showing the effect of scale on unit cost of production, where the lowest unit cost is described.

Modelling bioenergy feasibility

The Bioenergy Atlas for South Africa (BEA) generalisable feasibility model was developed to assess investment feasibility into bioenergy conversion technologies.

The components required by the algorithm to assess feasibility can be summarised as follows:

Mapping the extent and spatial and temporal availability of the different feedstocks that can potentially be exploited for bioenergy production over the lifespan of a technology option. Factors to consider include:

    1. Projected supply and demand of a feedstock.
    2. Potential spatial availability of a feedstock.
    3. Exclusion of feedstock from areas where it is not accessible (steep slopes, military bases etc.).

Bioenergy conversion from feedstock to energy product is a process where each technology option has its own economies of scale, scale-dependent process efficiencies, and also their scale-dependent capital and operational costs. Effective modelling of conversion technologies requires the following key data. 

    1. Feedstock type requirements (lignocellulose, lipids, etc.).
    2. Facility capacity (how many tonnes of feedstock can be processed per annum?).
    3. Capital expenditure (what is the capital investment required?).
    4. Operational expenditure (what are the operating costs?).
    5. Conversion efficiency (how efficient is the process technology at converting feedstock to bioenergy product?).
    6. Impact data (how many tonnes of carbon are emitted during the conversion process, are there additional energy inputs required, is water required?).

This is a modelling process of spatially clustering feedstock locations according to their location and volume to generate potential sites for the siting of a specific scale biomass conversion facility

Modelling the transport parameters involved in procuring biomass for conversion into bioenergy products. This involves the off-road and road transport from the point of growth of the biomass to the nearest roadside depot, transfer of biomass from the off-road vehicle to a road vehicle, and then the route on the road from a biomass depot to the proposed location of the biomass conversion facility (number of trips, number of vehicles, distances per route, etc.). 

The volume of feedstock available to each theoretical conversion facility site as well as the site-specific costs for biomass acquisition and the modelled costs of conversion into bioenergy product are used to calculate the total cost of production per unit of bioenergy product (Capex, Opex, transportation costs, harvesting and loading costs, etc.).

The unit cost of production for each proposed facility location for each technology option is then compared to determine which range of process technologies and facility capacities is most applicable for a given site. The unit cost can be compared to existing alternative options, for example, fossil fuels or other energy sources such as ethanol or wood chips and pellets.

In cases where the unit cost of production is competitive to existing alternative energy options, the impacts of the implementation of a chosen technology option per site can be quantified through numerous indicators such as emissions, or jobs, or other metrics

These modelled scenarios aim to confirm good choices and eliminate poor decisions. The advantage of the approach is as follows: 

  1. Parameterisation of the inputs and cost assumptions allows for modelling using custom values – this allows the BEA modelling platform to be used for custom feasibility analysis and scenario creation using inputs that are user-defined.
  2. Utilisation of existing road networks in the calculation of transport costs allows for the ranking and prioritisation of feedstock locations and the calculation of realistic transportation costs, thus allowing for prioritisation and planning of harvest.

The model is designed so that each model component or ‘thread’ can produce a set of analytical outputs that can be used as standalone products or connected to produce different output products. The advantage of this approach is that not all model components need to be re-run to create different model scenarios.

The model components are described in detail below, following logically from left to right.

Figure 1. Overview of the BioEnergy Atlas generalisable feasibility model

The flowchart on the left visually summarises the flow of information through a series of connected model threads collectively called the BioEnergy Atlas generalisable feasibility model. The schematic on the right provides a conceptual overview of how the model works. In this schematic example, various inputs (scenario parameters, such as feedstock data and conversion technology data) along with transportation data (road networks and other transportation parameters) are parsed to a facility allocation location component (the biomass conversion facility allocation thread) to determine the optimal location of a biomass process facility. This is done by first finding the feedstock location with the most biomass volume, then depleting its volume, followed by its nearest neighbours volume, until a facility capacity has been met. Once a facility has enough feedstock, its location is calculated using a weighted geographic coordinate, where the weights are feedstock volume. The outputs from this thread provide the start and endpoints that can be used for each biomass processing facility to calculate the transportation routes and costs (the biomass acquisition thread) using a custom coded version of the python open source NetworkX package (Aric et al., 2008). The outputs from this thread are saved as both shapefiles and tabular CSV files used by the biomass conversion cost thread and the comparisons thread to provide additional results, comparisons, and analysis.

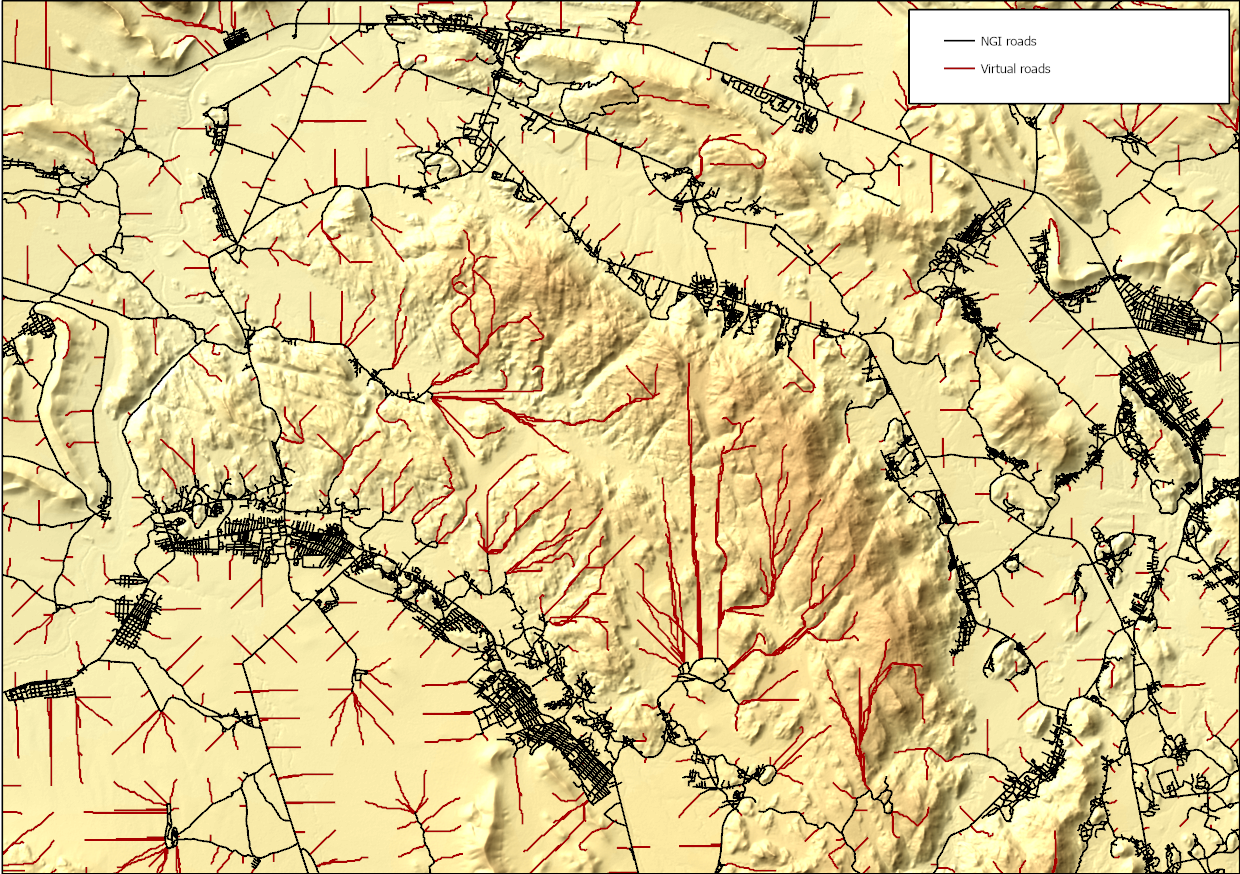
Figure 2. The virtual roads thread.

The virtual roads algorithm used a merged SRTM v3 digital elevation model (DEM) covering South Africa at a 1-arcsecond (~30m) resolution (2 711 921 602 pixels) for the generation of a cost surface. Here, the slope is calculated from the DEM using the ‘gdaldem’ processing algorithm (https://gdal.org/programs/gdaldem.html). The slope or DEM can be used as a cost surface (but an additional step is required to normalise each path using the DEM). Various obstacles were removed from the cost surface before calculating the minimum cost path. Next, the SANBI and STATS SA 100m Basic Spatial Unit or BSU raster [’+proj=aea +lat_1=-22 +lat_2=-38 +lat_0=-30 +lon_0=25 +x_0=1400000 +y_0=1300000 +datum=WGS84 +units=m +no_defs] was used to derive both the origin and destination points (in equally spaced meter units) using various nested aggregations of this grid. In the case of the origin points, a 1km aggregate of the BSU grid was generated, and the centroid of each grid cell was used for the start point locations. For the destination points,  South Africa’s National Geo-spatial Information (NGI) 2019 road layer (http://www.ngi.gov.za)  was rasterised into a 100m resolution aggregate of the BSU grid, and the centroids of all valid pixels were extracted as a destination point layer. These point layers were then reprojected to the same projection as the cost surface for various operations. A variable window approach was used to allow reasonable computational chunks and minimise edge effects that would otherwise exist when using standard SRTM tiles as an input. The window size was determined by selecting start points and associated ‘closest’ destination points, determined using a simple nested Euclidean distance function. The extent from the subset of start and destination points was used to determine the window size (along with a small buffer). The algorithm iterates through each 'window' by selecting a start point in each subset and finding its closest set of neighbours. For each of these n start points, it finds the closest set of N destination points (road points). The combined start and destination points are used to create an extent (the window) and crop the cost surface (with a small buffer) and road network into a workable size. The minimum cost path is calculated in each iteration for each origin point. Once a full set of paths in a window has been calculated, the origin points that were used are converted to polygons (i.e., given a small buffer), and a difference operation is performed to remove these values from the original start point layer. The next iteration is performed on a new subset of origin points until all the points have been depleted. The output (virtual roads) is fed into the biomass conversion facility allocation location thread.

Figure 3. The biomass conversion facility location-allocation thread.

This algorithm is used to cluster feedstock locations according to the location and volume to generate an optimal location of a biomass processing technology facility. Using the max volume from a volume field (in total tonnes) from a centroid input layer representing feedstock locations, it begins filling a facility capacity; if the volume from the max volume centroid location is used up before the capacity of a facility is met, it will fetch more volume from the next closest neighbour (in coordinate space) until the capacity of a facility is met. Using all the input points (whose volume was used to fill a facility), the facility location is determined as a weighted average in coordinate space. This process is repeated until all volumes are depleted from the input centroid layer. Once all the feedstock input layer volume has been depleted, the function ends. It parses various inputs to the biomass acquisition thread during the loop operation to perform the transportation routing.

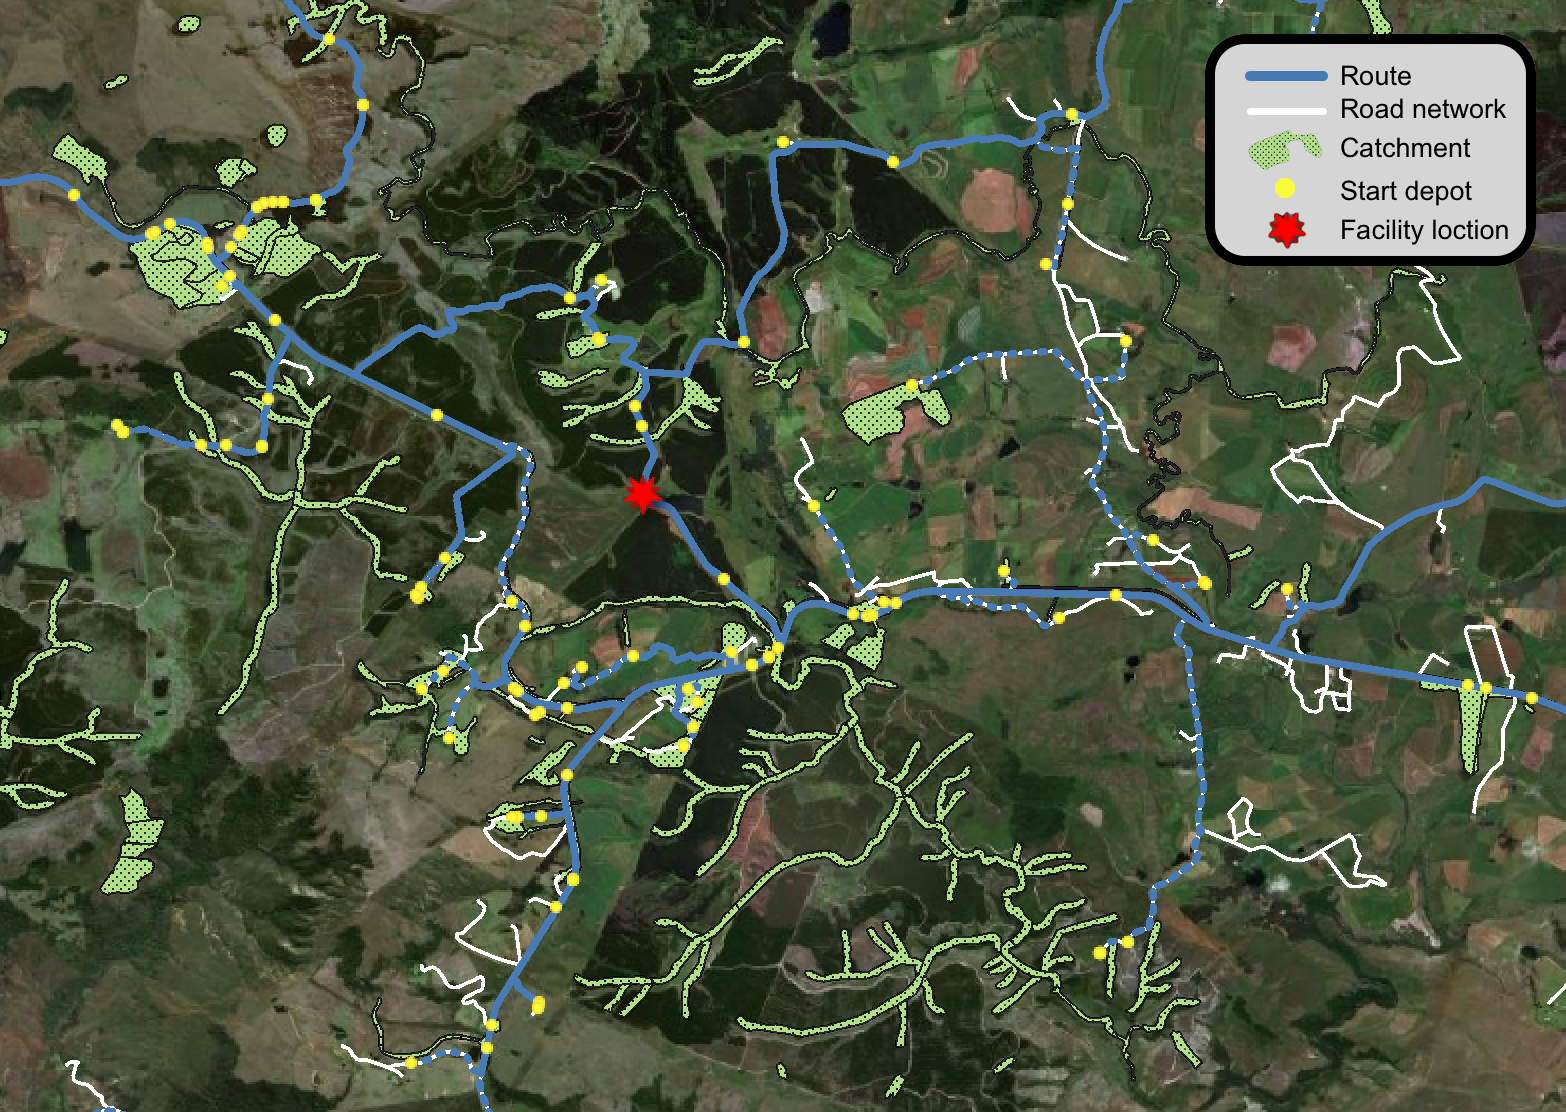
Figure 4. The biomass acquisition thread.

This thread forms part of a subprocess of the biomass conversion facility location-allocation thread. It determines if the new facility location and its feedstock locations need to snap to the closest road or closest virtual road start point, in which case it maps the distance from a virtual road to the nearest road. During the operation, it crops various inputs to the extent of the points created in the biomass conversion facility location-allocation thread (these include roads, virtual road start and endpoints, and proximity raster’s for the virtual roads and main roads). It then adds the temporary start and endpoints from the biomass conversion facility location-allocation thread as new vertices in the clipped road layer to create a graph and perform the transport routing. Transport modelling is done using Dijkstra’s algorithm (Dijkstra, E. W., 1959) in a custom coded version of the python NetworkX package (Aric et el., 2008). It appends information to a technology output CSV and writes out various shapefiles during the run of a complete set of scenarios with different technology capacity inputs from the biomass conversion facility location-allocation thread. These outputs are used in the biomass conversion cost thread.

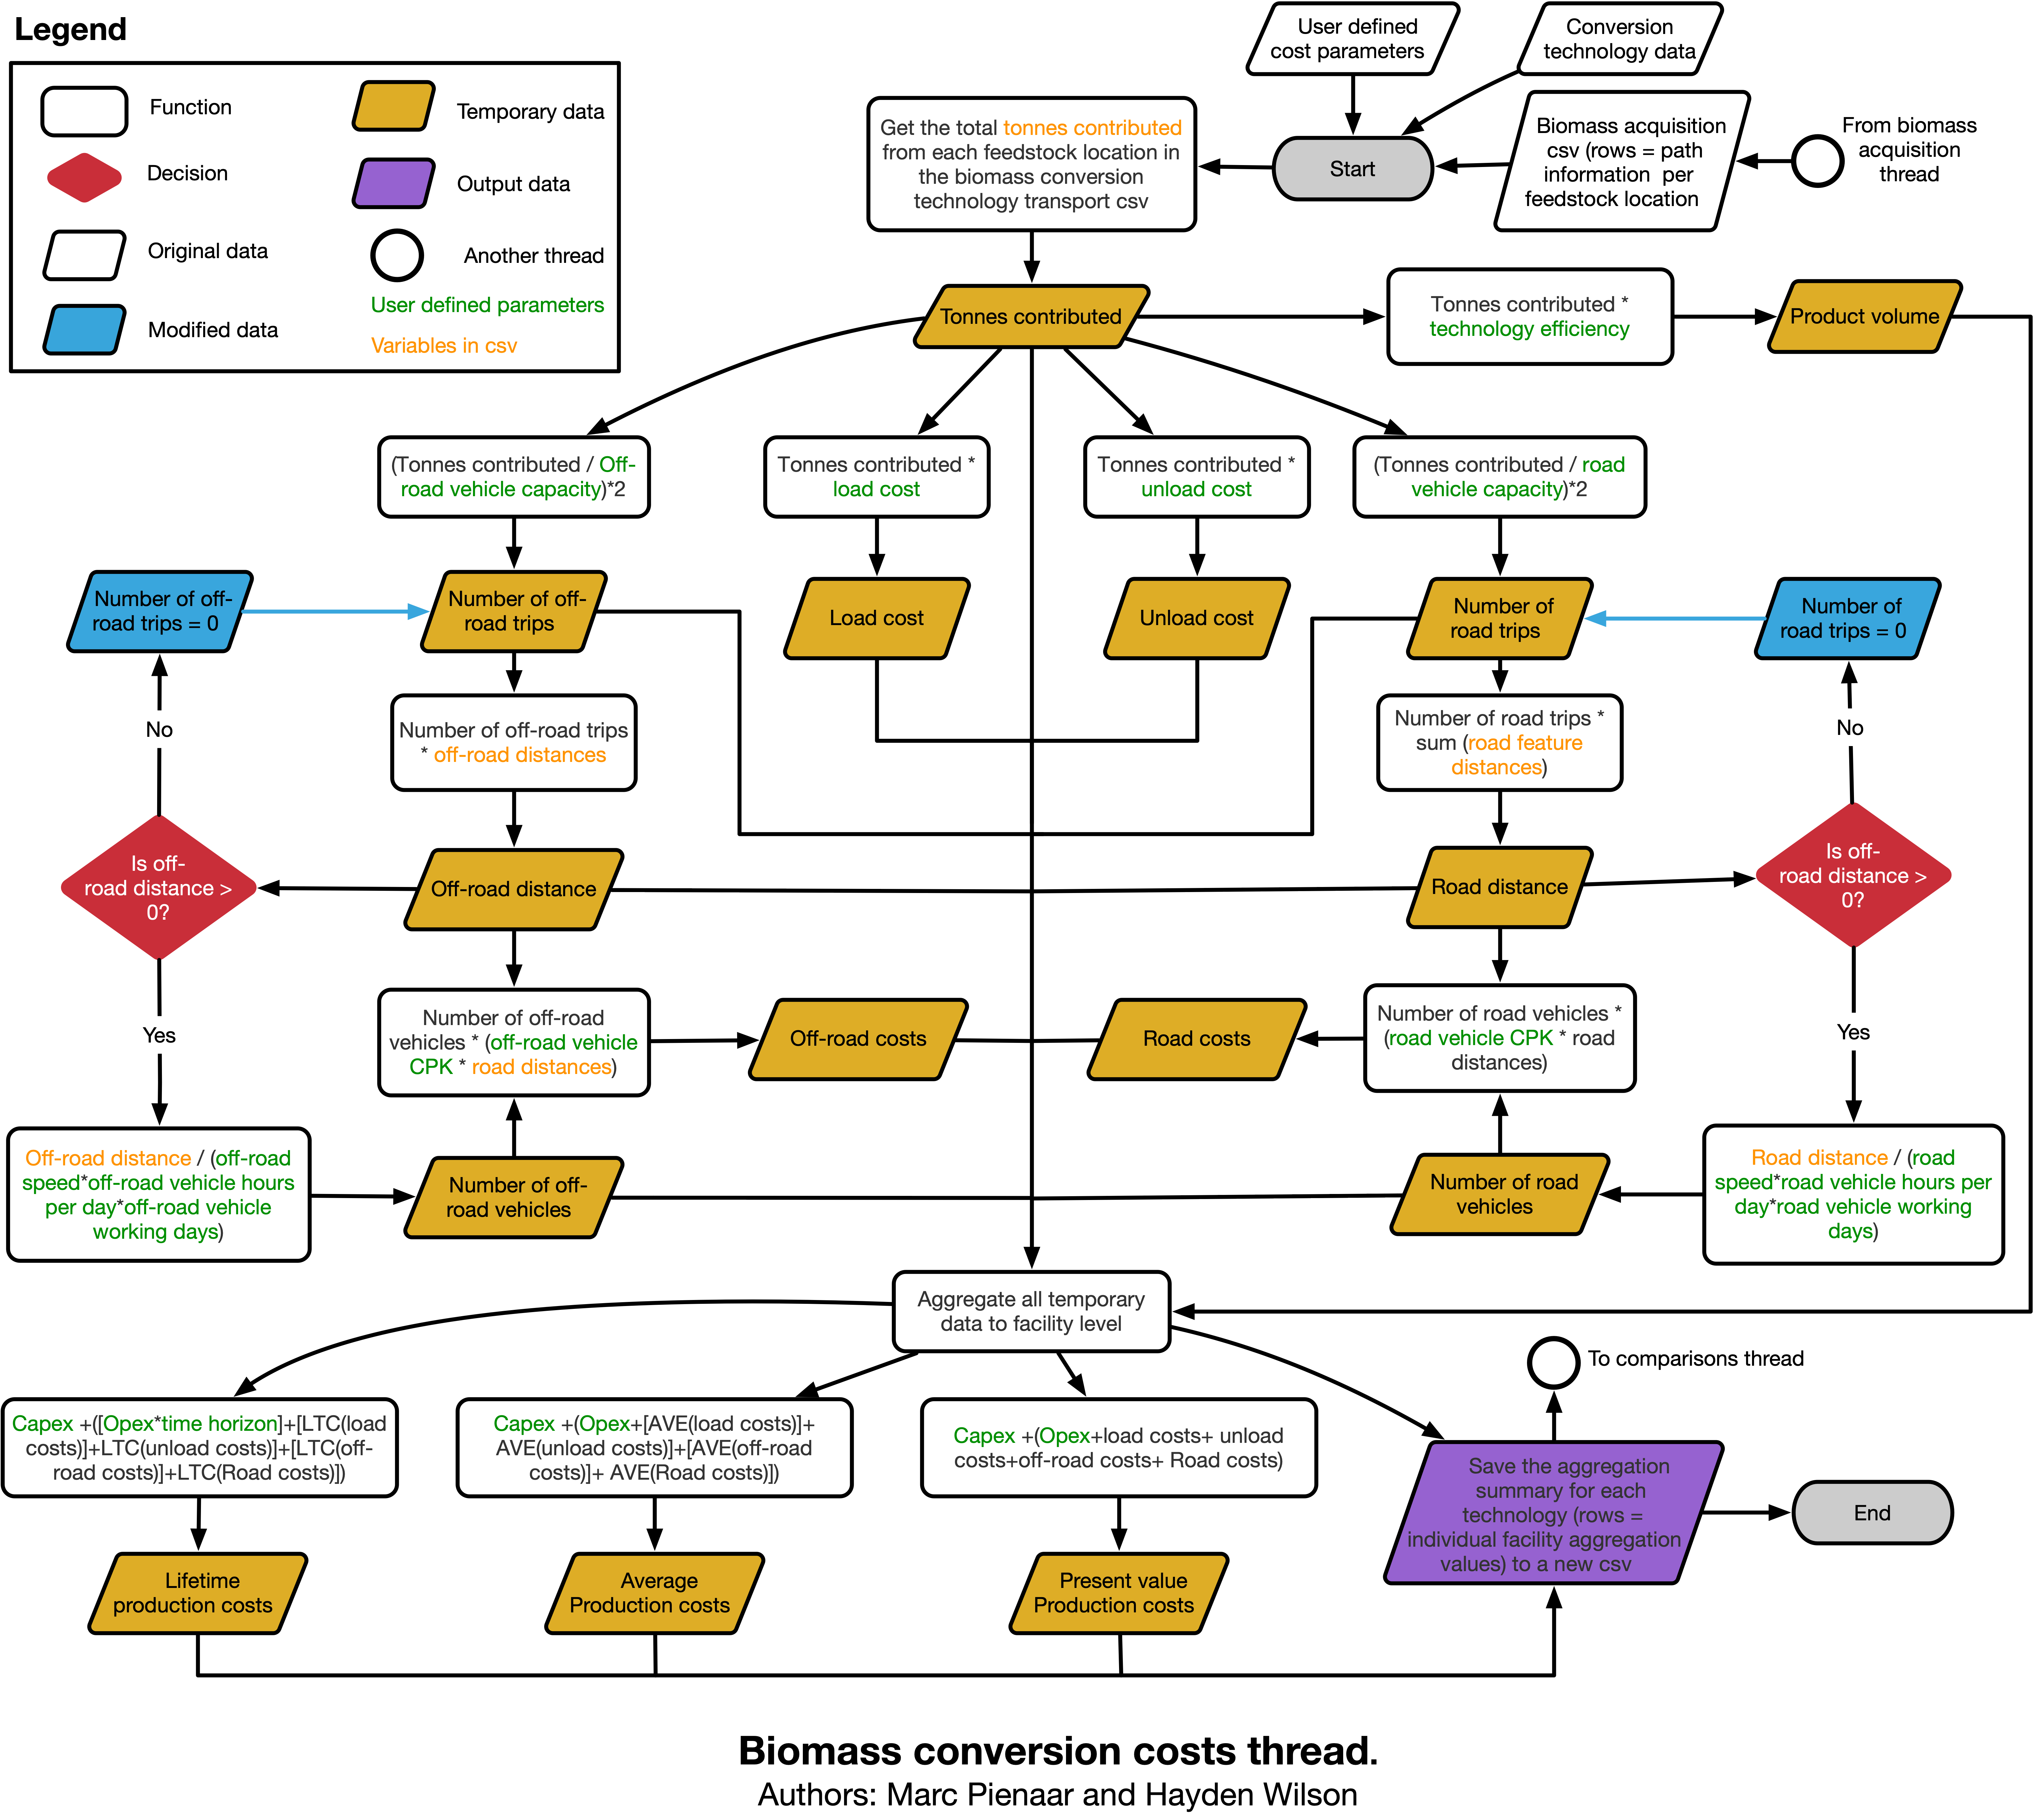
Figure 5. The biomass conversion costs thread - 

Calculation of the final unit cost of production requires that for each modelled potential facility location, the distances to collect biomass for each facility and the volume of biomass transported along each of the biomass supply routes for each facility are used in conjunction with user-defined input parameters.

User-defined input parameters include, but are not limited to: 

  1. Harvest cost (R/t, R/ha, or R/hr).
  2. Harvest rates (t/hr or ha/hr).
  3. loading rates (t/hr).
  4. loading costs (R/t or R/hr).
  5. Off-road vehicle capacity (tonnes or m3).
  6. Average off-road vehicle speed (km/hr).
  7. Off-road vehicle cost per km (CPK).
  8. Road vehicle capacity (tonnes or m3).
  9. Average road vehicle speed (km/hr).
  10. Road vehicle cost per kilometer (CPK).
  11. Offloading rates (t/hr).
  12. Offloading costs (R/t or R/hr).
  13. Interest rates on loans (%).
  14. Inflation estimates.
  15. Period of operation (yrs) - the lifetime costs (LTC) in the schematic above.
  16. Number of working days per year (days).
  17. Number of working hours in a day (hrs).
  18. Other unforeseen expenses such as salaries, etc.

Calculation of the unit cost for the bioenergy end product is dependent on which conversion technology is being used to create the bioenergy end product. The BioEnergy Atlas has a conversion technology database that provides parameters used in the modelling process to describe the end unit cost of production; however, for use cases that deviate from the database, user-defined inputs can be specified. These include:

  1.  Production facility capital expenditure based on the facility size.
  2. Annual operation expenditure based on the yearly biomass throughput.
  3. Conversion efficiency (%).
  4. External energy inputs (electrical or thermal, MJ/t).

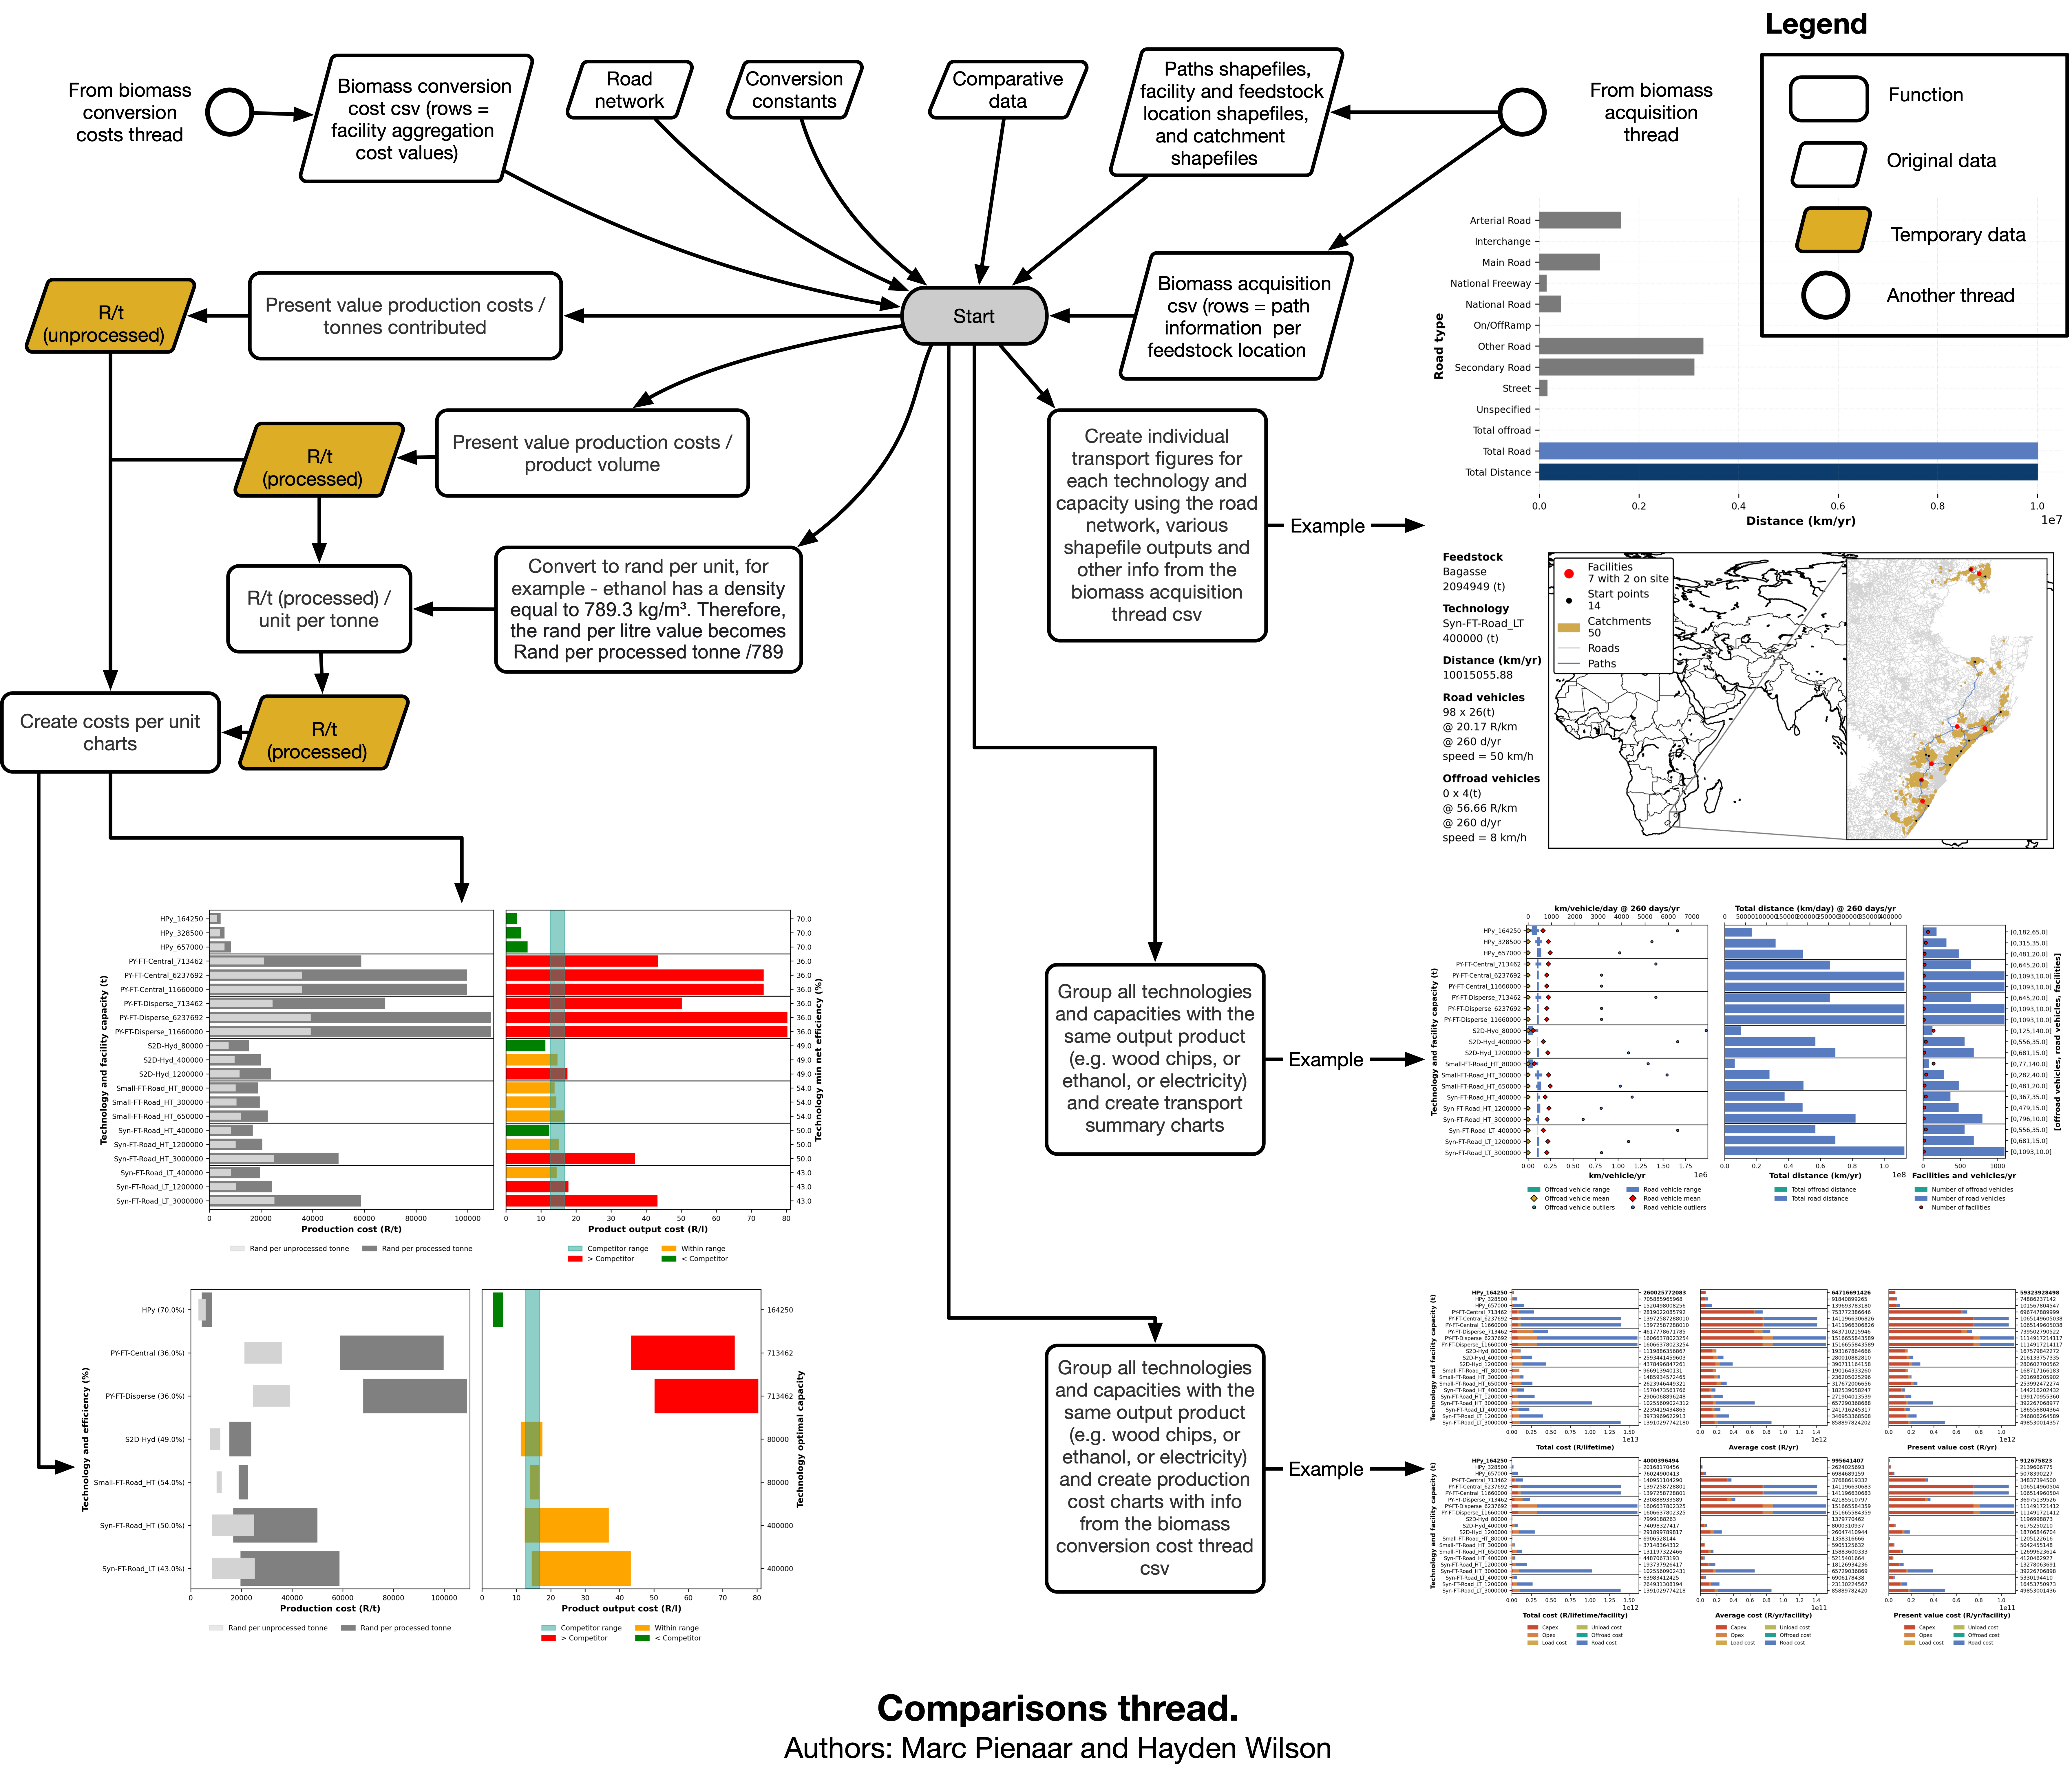
Figure 6. The Comparisons thread.

The feasibility of the different bioenergy technology options is primarily determined by the price competitiveness of the bioenergy conversion option with existing alternatives. Analyses of the unit cost of production, when compared to current competing energy products, allows for the determination of the price margin for bioenergy production at each of the candidate facility locations.

The outputs from all the threads are used to create chart summaries and CSV outputs to analyse each process technology. These are described in detail in each of the case studies. 

Resources

Modelling off-road transportation routes (virtual roads) and costs

Certain bioenergy feedstocks are not located in areas with easy road access. It was thus necessary to develop a way of determining off-road transportation costs. The virtual roads algorithm (see GitHub link) was developed to address this problem and is fed into the generalisable feasibility model to derived additional transportation costs. The virtual road network avoids obstacles such as river crossings and areas with steep slopes (>15 degrees).

Modelling the optimal locations of bioenergy conversion facilities

The BioEnergy Atlas generalisable feasibility model determines the optimal location for a potential biomass conversion facility by clustering its feedstock requirements from a feedstock catchment area. After a cluster has been calculated, the facility is placed within the cluster, and all routes and costs from feedstock locations are calculated. Finally, the facility is positioned at a site where the transport distance via a road network is minimised.

Bibliography

  1. Aric A. Hagberg, Daniel A. Schult and Pieter J. Swart, “Exploring network structure, dynamics, and function using NetworkX”, in Proceedings of the 7th Python in Science Conference (SciPy2008), Gäel Varoquaux, Travis Vaught, and Jarrod Millman (Eds), (Pasadena, CA USA), pp. 11–15, Aug 2008

  2. Bioenergy Resources and Technologies – energypedia.info, viewed 30 April 2021, <https://energypedia.info/wiki/Bioenergy_Resources_and_Technologies>

  3. Biomass Pelletization Process | BioEnergy Consult, viewed 30 April 2021, <https://www.bioenergyconsult.com/biomass-pelletization/>

  4. Dijkstra, E. W. (1959). A note on two problems in connexion with graphs. Numerische Mathematik, 1(1), 269–271.

  5. Farr, T.G., Rosen, P.A., Caro, E., Crippen, R., Duren, R., Hensley, S., Kobrick, M., Paller, M., Rodriguez, E., Roth, L., Seal, D., Shaffer, S., Shimada, J., Umland, J., Werner, M., Oskin, M., Burbank, D., and Alsdorf, D.E., 2007, The shuttle radar topography mission: Reviews of Geophysics, v. 45, no. 2, RG2004, at <https://doi.org/10.1029/2005RG000183>.

  6. Johansson J, Liss J, Gullberg T, Bjorheden R. 2006. Transport and handling of forest energy bundles – advantages and problems. Biomass and Bioenergy 30:334-341.

  7. Searcy,  E., Flynn, P., Ghafoori, E., Kumar, A. 2007.Applied Biochemistry and Biotechnology: The relative cost of biomass energy transport. Vol 137 (1), pp. 639-652,. Springer.

  8. Van der Walt, S., Sch”onberger, Johannes L, Nunez-Iglesias, J., Boulogne, Franccois, Warner, J. D., Yager, N., … Yu, T. (2014). scikit-image: image processing in Python. PeerJ, 2, e453.