

Biomass production in South Africa largely follows a climatic gradient primarily driven by rainfall, with the highest biomass production occurring within the country’s eastern regions or near the coastline.
Within the content of the BioEnergy Atlas, productivity is described as the rate at which biomass is produced. There are two basic types of productivity: gross and net.
- Gross primary productivity, or GPP, is a measure of the total amount of carbon captured by plants as a result of photosynthesis (Amthor and Baldocchi, 2001)
- Net primary productivity, or NPP, is the difference between gross primary productivity and the amount of carbon released into the atmosphere due to cellular respiration. NPP can be used as a rate at which energy is stored as biomass by plants or other primary producers and made available to the consumers in the ecosystem (Schultze, 2007).
Net Primary Productivity is viewed as a raw potential or baseline for biomass production (Schultze, 2007), and this is extensively modified by land use. Hence, the local soil types, current land cover, extent of degradation, and improved yields due to intensive agriculture all play a role in modifying the baseline NPP.
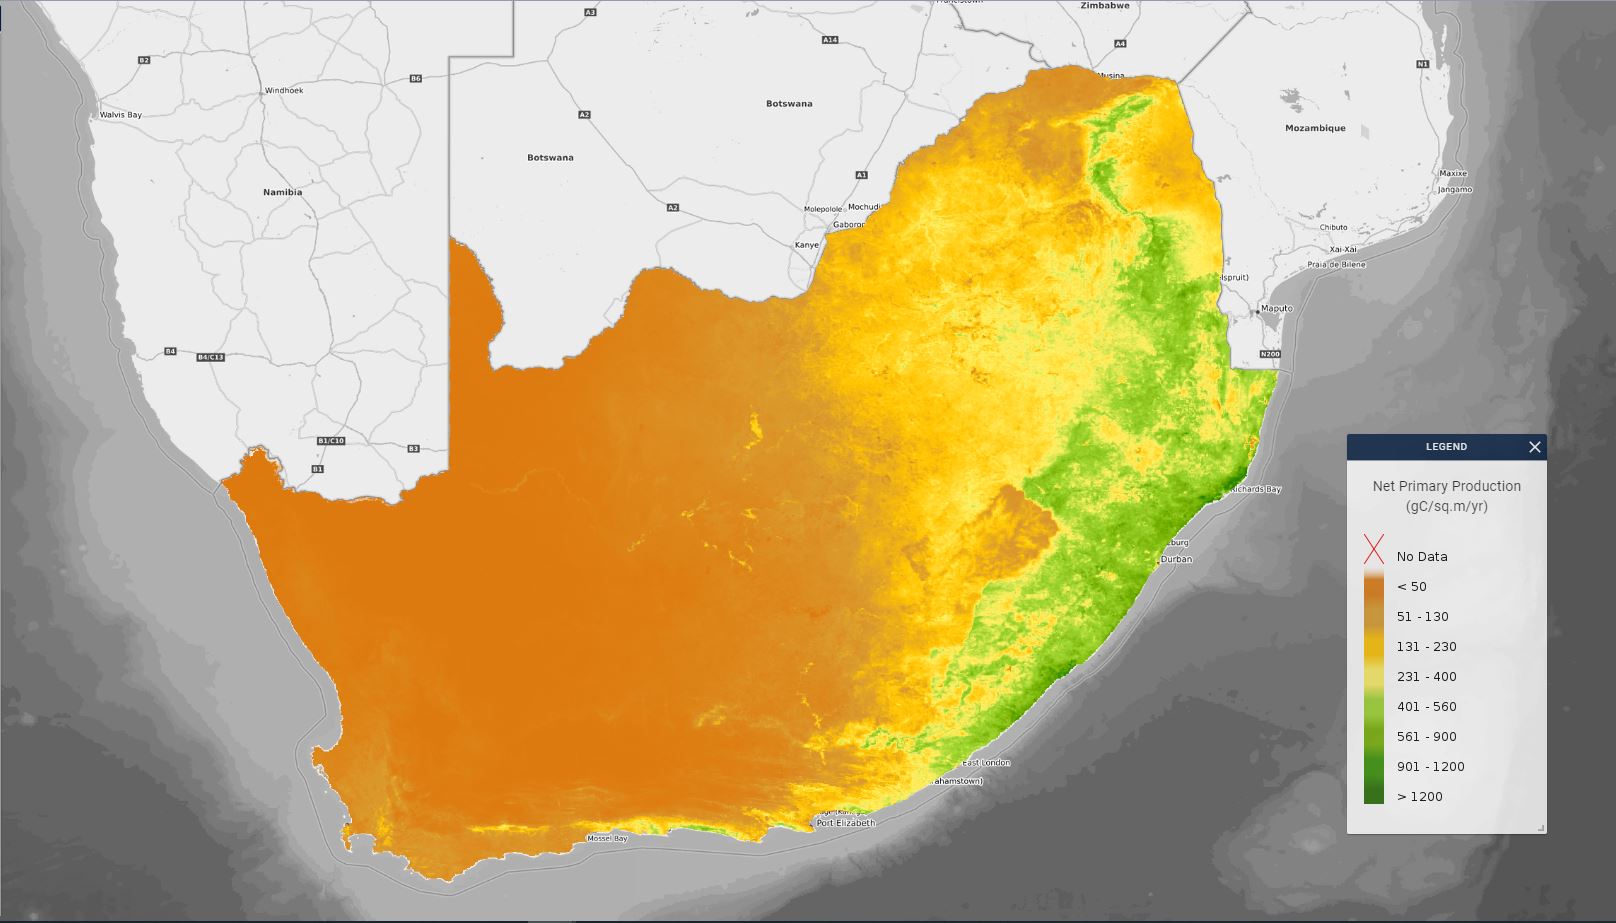
Figure 1: Average annual Net primary Production for South Africa (DFFE, 2015)
Biomass production in South Africa follows a climatic gradient, with the primary climatic variables affecting Biomass production being precipitation (Hugo W. (Ed). 2015. South African BioEnergy Atlas.)
South Africa generally experiences temperate conditions throughout the year due to its subtropical location, but the moderating effect of the Atlantic and Indian Oceans and its varied topography result in a great variety of climatic zones, ranging from the dry north-western to the wet eastern regions of the country. Most of South Africa is semi-arid and water-stressed, with an average rainfall of about 450 mm, approximately 60% of the world average (Schulze, 2007).
Precipitation in South Africa is highly variable, with an uneven spatial distribution and seasonality of rainfall. The eastern and southern parts of the country receive significantly more rain than the northern and western regions. While most of the country is generally a summer-rainfall region, the extreme southwest has a Mediterranean climate characterised by marked aridity during summer months. The rainfall in this region occurs predominantly during the winter period (Tyson and Preston-Whyte 2000).
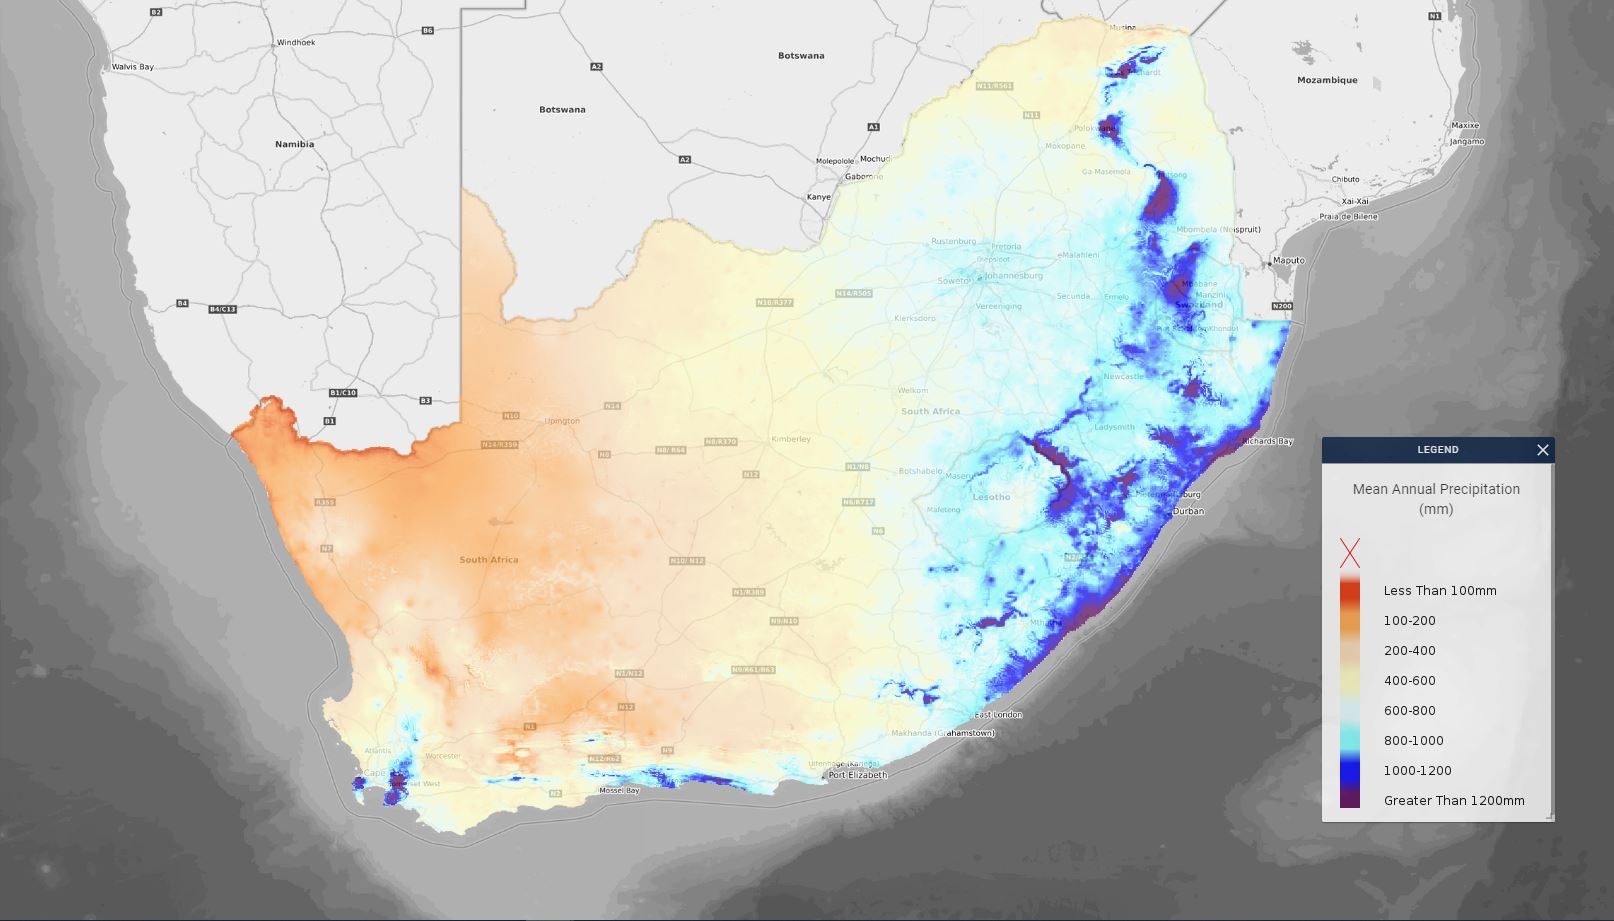
Figure 2: Mean annual precipitation (mm) (Schultze and Lynch, 2007)
Land use and Landcover changes dramatically modify the basal net primary productivity. Practices such as intensive agriculture can significantly increase the volume of biomass produced in an unproductive area, whereas changes from one land cover type to another, such as forestry to crop agriculture would have the opposite effect. Processes such as urbanisation reduce the areas for biomass production, but at the same time, activities such as the transportation and production of fuel and food for growing urban populations, as well as the resultant waste streams, may make significant point or distributed contributions to the availability of biomass.
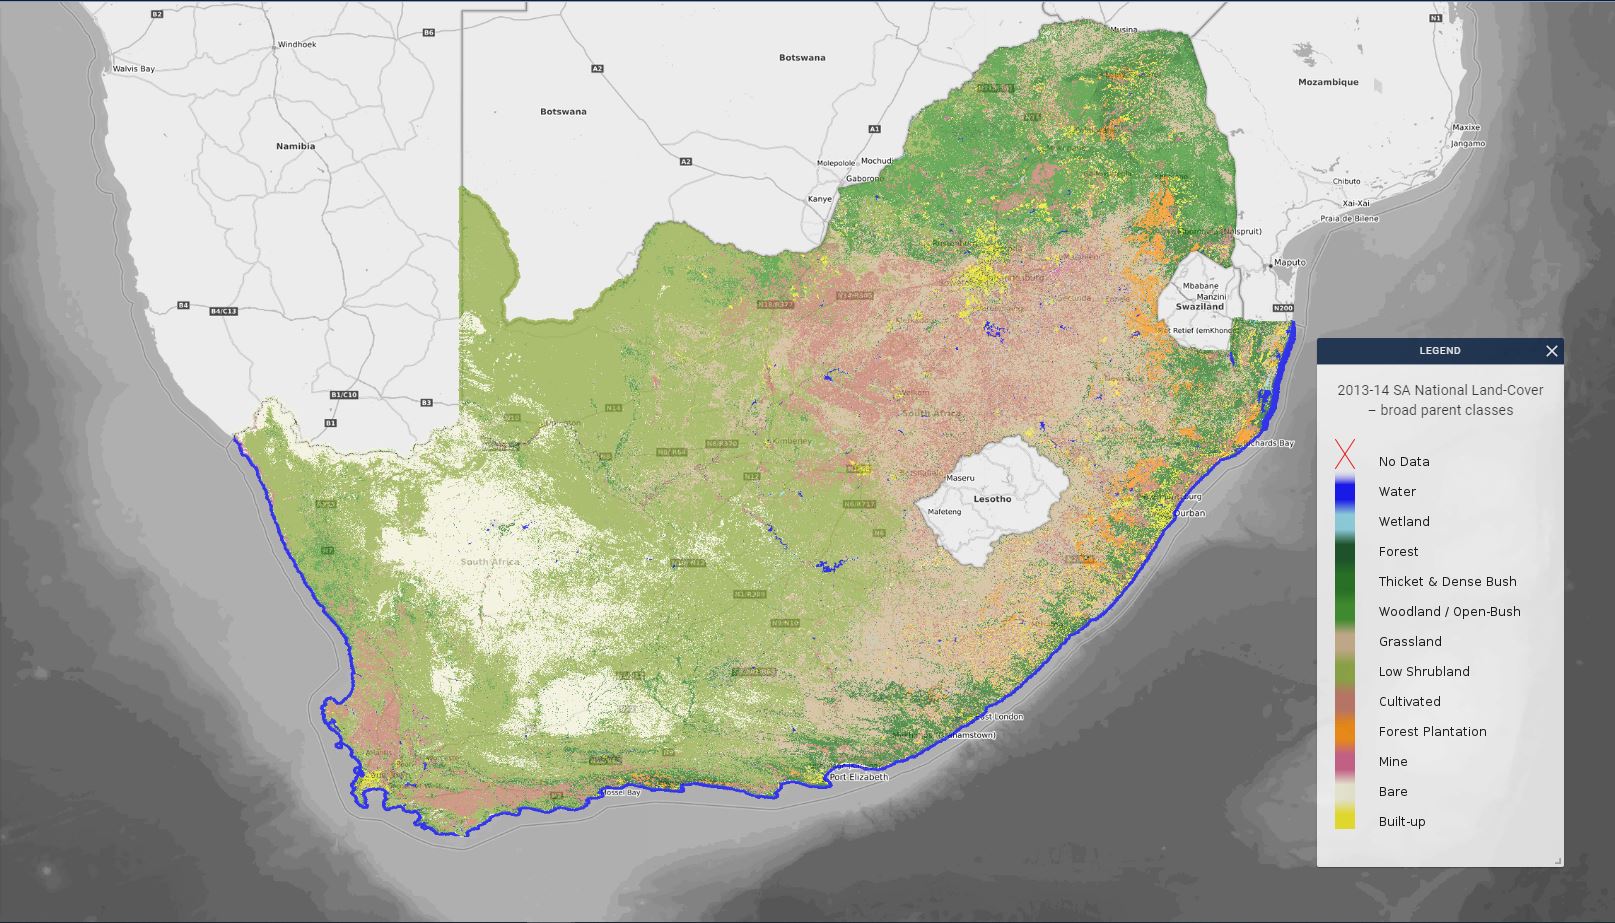
Figure 3: Landcover of South Africa (Broad Parent Classes) (DFFE, 2014)
The potential available land for biomass production has competing interests for land use. In South Africa, these competing interests include:
A. Current agricultural land and food security: Ensuring food security is considered a priority, thus projections of the amount of available land that could potentially be used for bioenergy production need to quantifications and projections of:
- Future population: A growing population will require additional food production, and if the relative affluence also improves, consumption patterns are likely to change.
- Improved yields: It may be possible, all other things being constant, to repurpose some farmland for bioenergy use if yields of traditional crops increase significantly.
- Climate change: The far future may require additional farmland for some crops due to changing conditions, while the productivity of others could increase due to higher temperatures and CO2 concentrations. The net effect of this is a change in the quantum of farmland is required to maintain the status quo.
B. Commercial forestry: Waste products from the Forestry Industry have the potential to be used as a bioenergy feedstock; however, there are management considerations regarding the potential nutrient loss as a result of removing in situ forestry residue that need to be understood. In the BioEnergy Atlas for South Africa, we assume that the existing plantation areas will not be repurposed but that a portion of forestry residue is available for beneficiation.
- The BioEnergy Atlas has collaborated with the Institute for commercial forestry research (ICFR) to develop a toolkit for assessing the potential nutrient losses associated with varying levels of forestry residue removal and site soil characteristics.
C. Urban and mining areas: These are by definition not available for biomass production, but rehabilitated mining land could support biomass feedstock streams. Future urban growth would contribute to the availability of domestic or industrial waste.
- These are currently proclaimed as national or provincial parks, and it is doubtful that biomass will be obtained from these areas, except for invasive species.
- National protected areas expansion strategy: These areas have been identified, but not proclaimed, as possible future protected areas. Depending on the trade-off between conservation and energy diversification, a variable portion of these areas could be considered for biomass generation. Invasive species from these areas are considered part of the available biomass.
- Ecosystem services: Some areas of the country, while not protected, are critical to preserving ecosystem services, and water is the most important consideration here. Again, a trade-off between conservation and energy diversification determines to what extent these areas are considered for biomass cultivation, and invasive species in these areas are included in estimates.
- Sensitive biodiversity areas: These are subject to the same trade-offs and considerations discussed above.
Non-usable land These are areas that may or may not be suitable for biomass generation but are excluded based on accessibility, slope, soil conditions, or other factors that will make sustainable biomass generation difficult.
The BioEnergy Atlas presents a number of different feedstocks that can be sourced from different landcover types – these include:
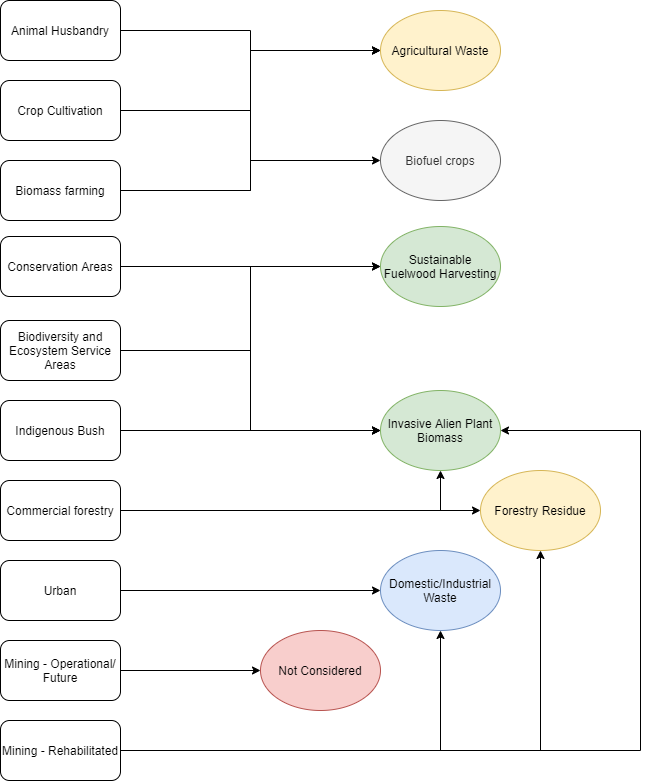
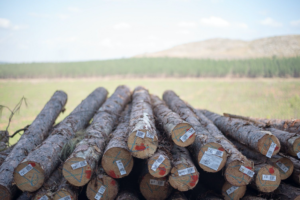
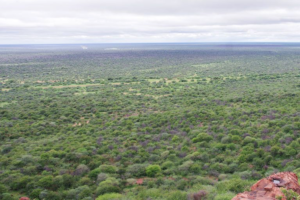
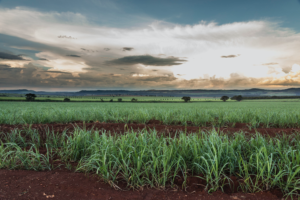
Chart 3: Ownership status of commercial forestry regions in South Africa by area (ha) (ICFR, 2020).
Forestry accounts for 1,37 million hectares of land (1.1%) of the available land in South Africa (ICFR, 2020). Of that, the majority of the land (820 530 ha) belongs to corporates, with the remaining land being broken into the other categories as showcased below:
The forestry industry represents a significant producer of biomass in the form of wood for the timber, paper and pulp industries. A breakdown of the volumes of biomass produced in 2018 is as follows (Forestry SA, 2018):
- Pulpwood – 12.464 Million m3
- Sawlogs – 4.702 Million m3
- Mining Timber – 0.421 Million m3
- Other – 0.375 Million m3
- Poles – 0.370 Million m3
Forestry residue also represents a significant source of biomass; however, the volume of residue available from forestry regions is largely determined by the land management decisions regarding maintenance of soil quality.
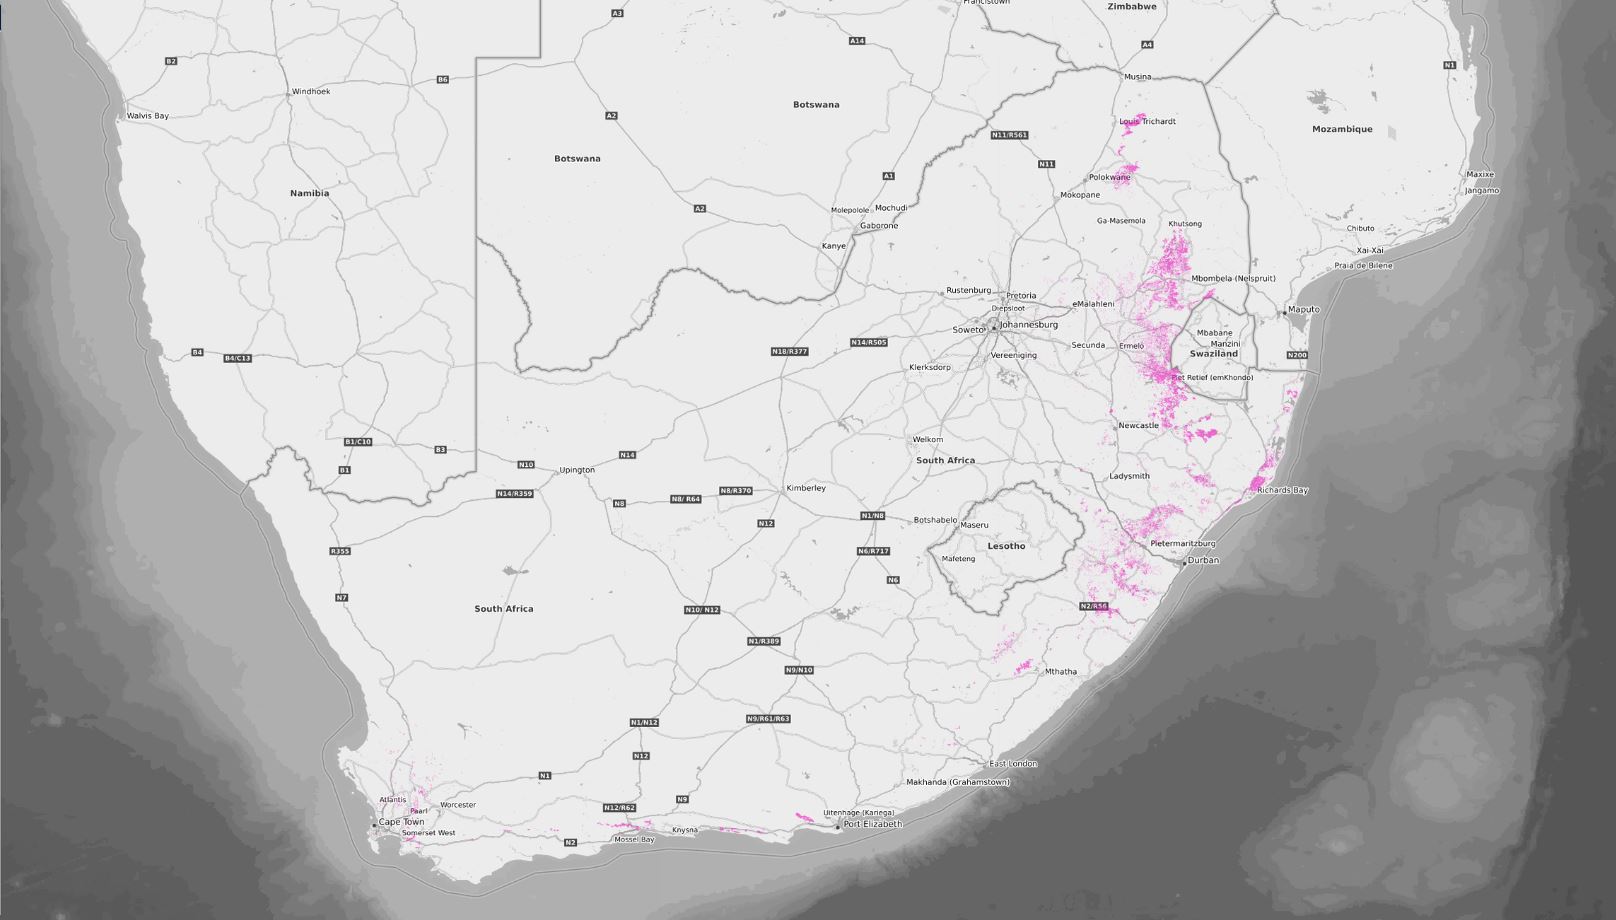
Figure 4: Commercial forestry areas of South Africa (ICFR 2020)
Increases in woody plant density have been observed in non-forest regions of Southern Africa since the late 19th century (O’ Connor et al., 2014). While increased precipitation and CO2 levels within the atmosphere do convey a competitive advantage to C3 woody species, the drivers for an increase in woody plant density are closely linked to land management practices, where processes such as herbivory and fire frequency account for 78% of the differences in spatial coverage of bush encroached areas (Venter et al., 2018). It has been observed that woody plant encroachment has been most rapid within small protected areas and significantly slower within communal rangeland areas and large protected areas where macro-herbivores are present.
Grazing pressure on grasslands has been shown to affect the rate of woody plant encroachment. The most significant increases in woody cover occurred during the 1970s when there was considerable pressure on grasslands following the drought of the 1960s and the volume of cattle being maintained on grassland ecosystems. Within areas where fire and herbivory are excluded, It has been observed that there is a linear relationship between woody plant growth and mean annual rainfall (O’Connor et al., 2014).
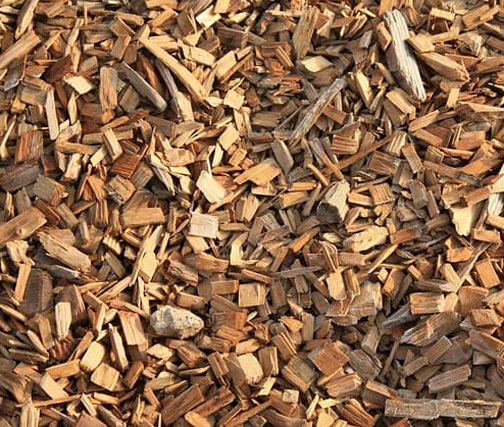
The clearing of bush encroachment from areas, has the potential to provide a significant source of biomass for beneficiation industries; while also meeting land-owner management objectives in the form of bush clearing.
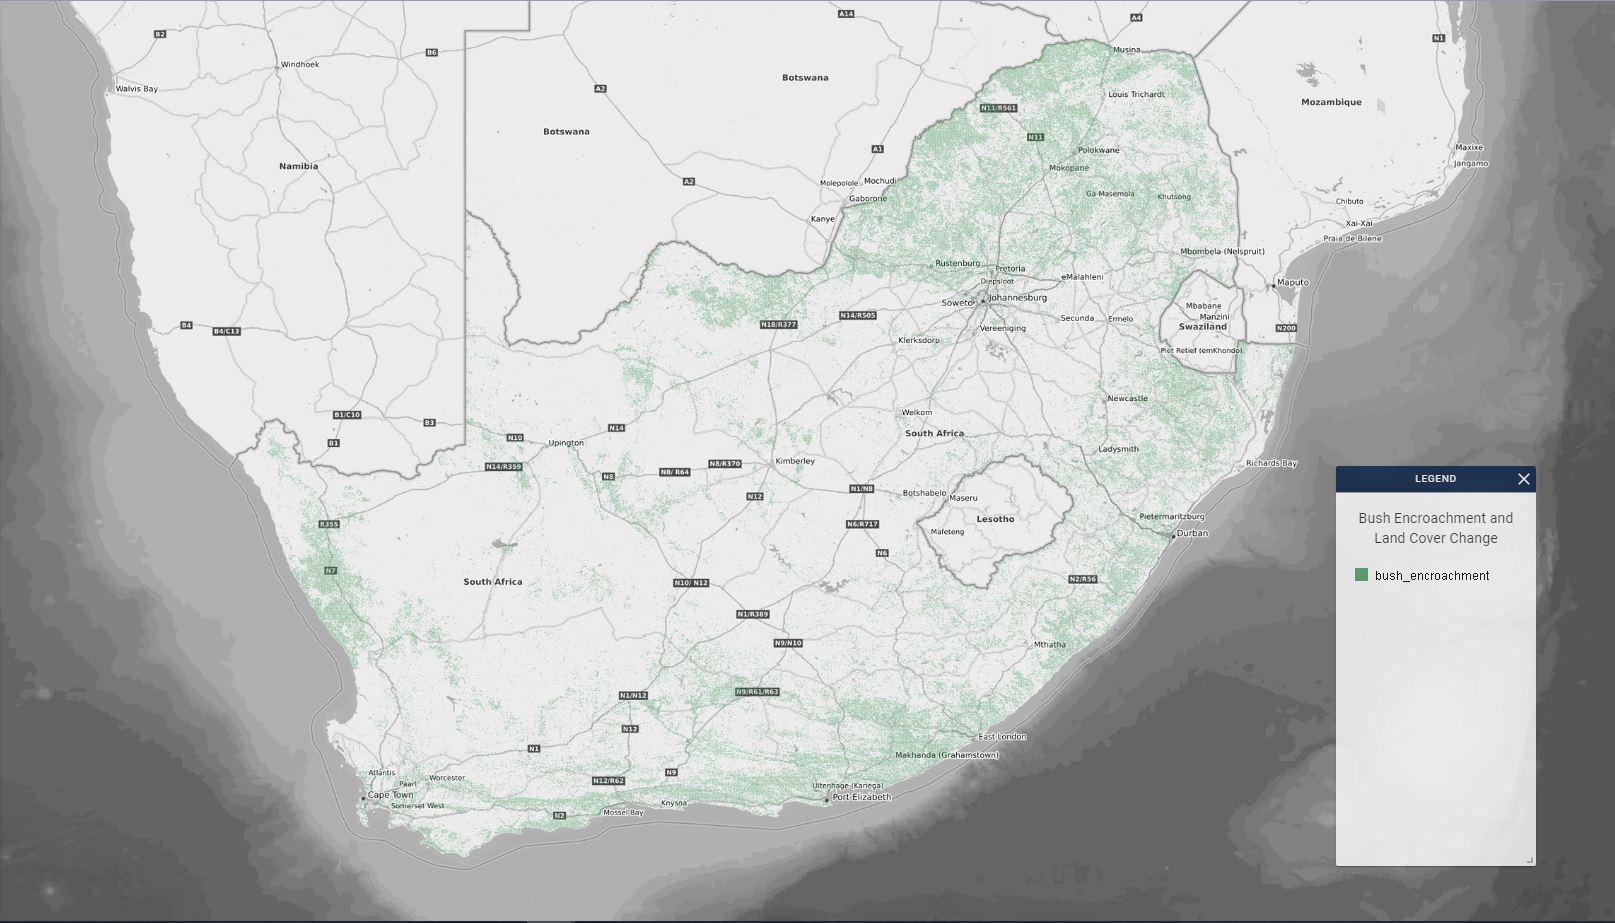
Figure 5: Woodland expansion areas within South Africa between 1990 and 2013 (Skowno et al., 2016)
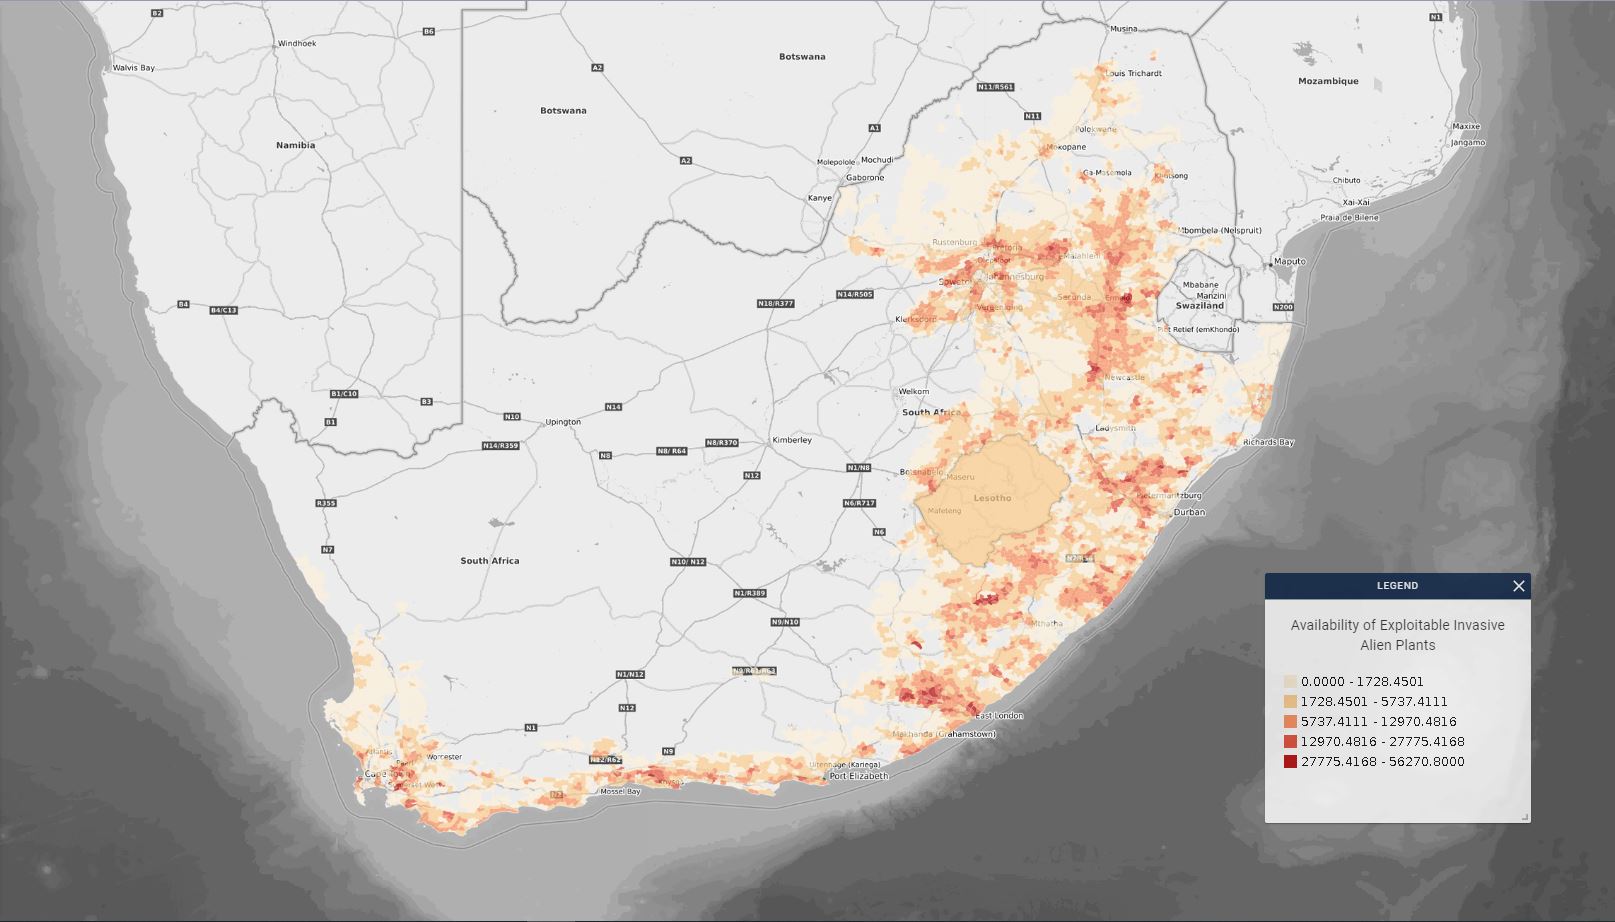
Invasive Alien Plant Species (IAPS) are plant species that have been introduced to South Africa from other regions. These plants can outcompete indigenous species due to having very few natural predators and having physical traits that allow them to better access resources than indigenous species (Rodríguez-Labajos et al., 2009).
In addition to representing a significant threat to biodiversity and ecosystem function, IAPS also affect South Africa’s water security. It is estimated that 9000 plant species have been introduced to South Africa, with 198 species currently classified as invasive. (https://www.wwf.org.za/?1500/Working-for-Water) Estimates of the current cover of invasive plant species show that approximately 10% of the surface area of the country is invaded, with the largest invaded areas being located in the Eastern Cape, Kwazulu-Natal and Mpumalanga. Programs such as the Working for Water Program (administered by the Department of Environment, Forestries and Fisheries Natural Resource Management Unit) have been set up to eradicate alien invasive plant species. They are responsible for clearing more than one million hectares of invasive alien plants while also providing jobs and training to approximately 20 000 people, assisting with rural development objectives. (https://www.environment.gov.za/projectsprogrammes/wfw).
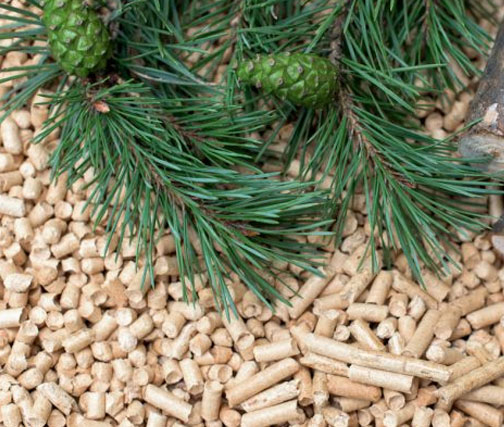
Many IAPS are suitable candidates to serve as bioenergy feedstocks (Pinus spp, Eucalyptus spp, Prosopis spp, to name a few). A summary of the available biomass that can be sourced from invasive alien plant species is presented below:
Organic waste production in South Africa represents another potential source of biomass. Liquid biomass in the form of sewerage can produce BioGas, while solid organic waste can produce various bioenergy products.
Organic waste falls into two categories: serviced waste collected from municipalities and processed within waste disposal sites, and unserviced waste, typically burnt or disposed of informally.
The volumes of each waste category are presented below:
Chart 5: The volumes and types of waste available within each province in South Africa (Hugo., 2015)
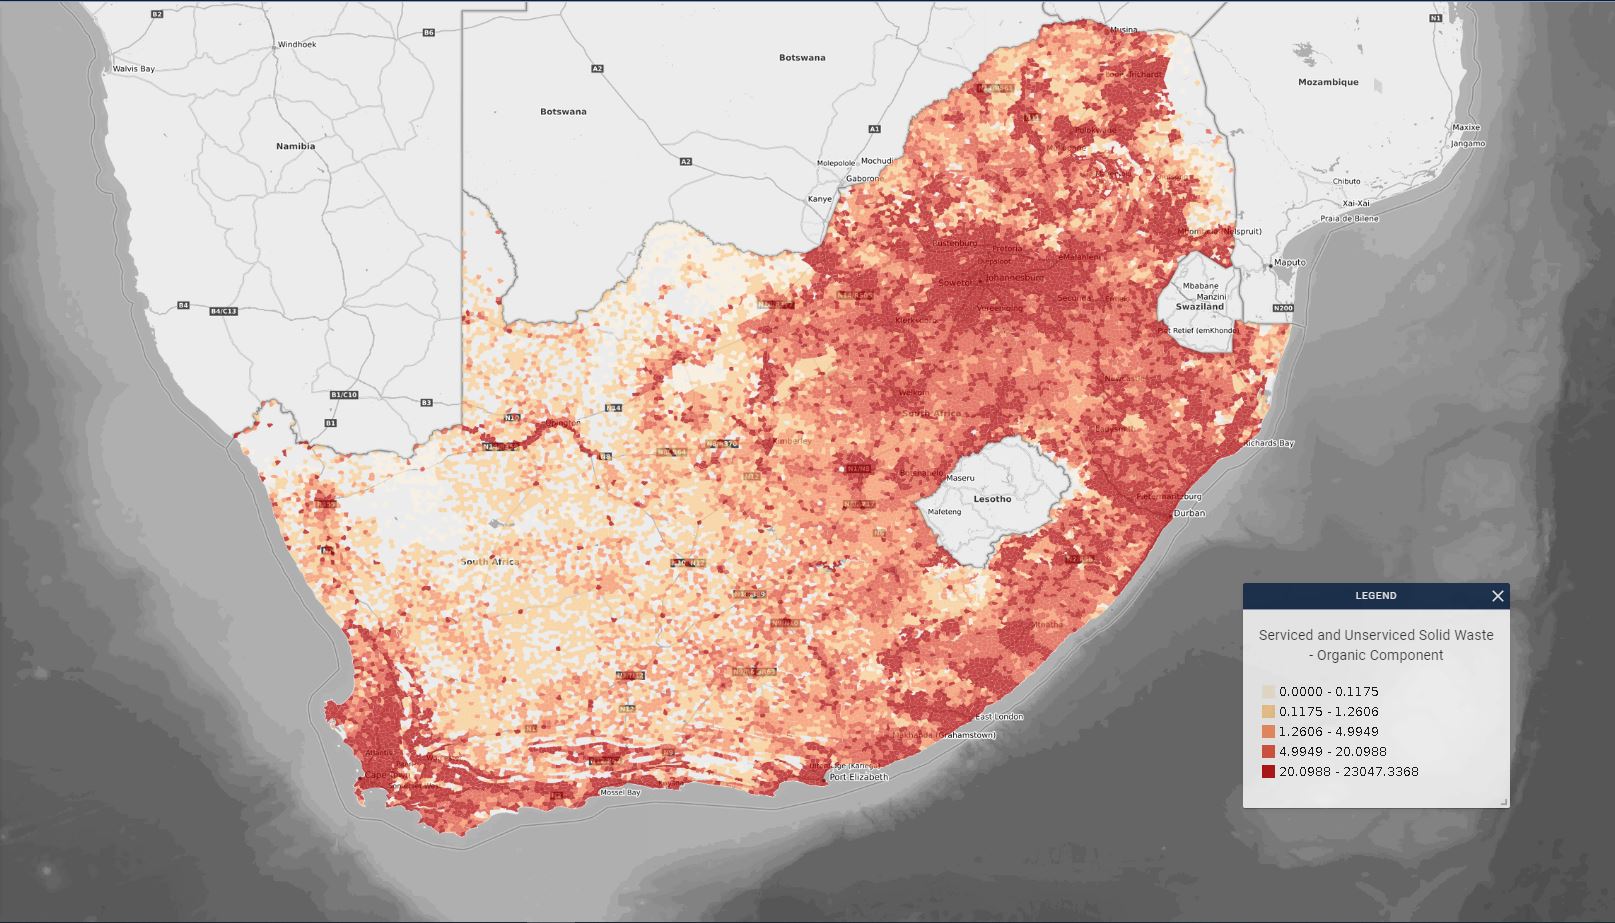
Figure 7: availability of serviced and unserviced organic waste in tonnes/annum (Hugo, 2015)
The South African Agriculture Census (2017) shows that in 2017, the total number of farms/ farming units involved in the commercial agriculture industry was 40 122, of these 13 639 were involved in livestock farming, followed by 12 458 involved in mixed farming and 8 559 growing field crops.
In 2017, South Africa’s total agricultural area was 46,4 million hectares, of which, 36,5 million hectares were used for livestock rearing and 7,6 million hectares were used for crop production.
The wastes and residues associated with livestock farming can potentially be used for bioenergy production; however, residue such as dung typically remains in the field to maintain soil fertility, or if the livestock is reared in feedlots or similar, then the waste products are usually repurposed for fertiliser (DAFF, 2018).
The BioEnergy Atlas has thus focused on the use of agriculture residues or purpose grown crops within current crop production regions.
A summary of the current crop production area is defined below:
Chart 6: Crop production area per province and agricultural practice.
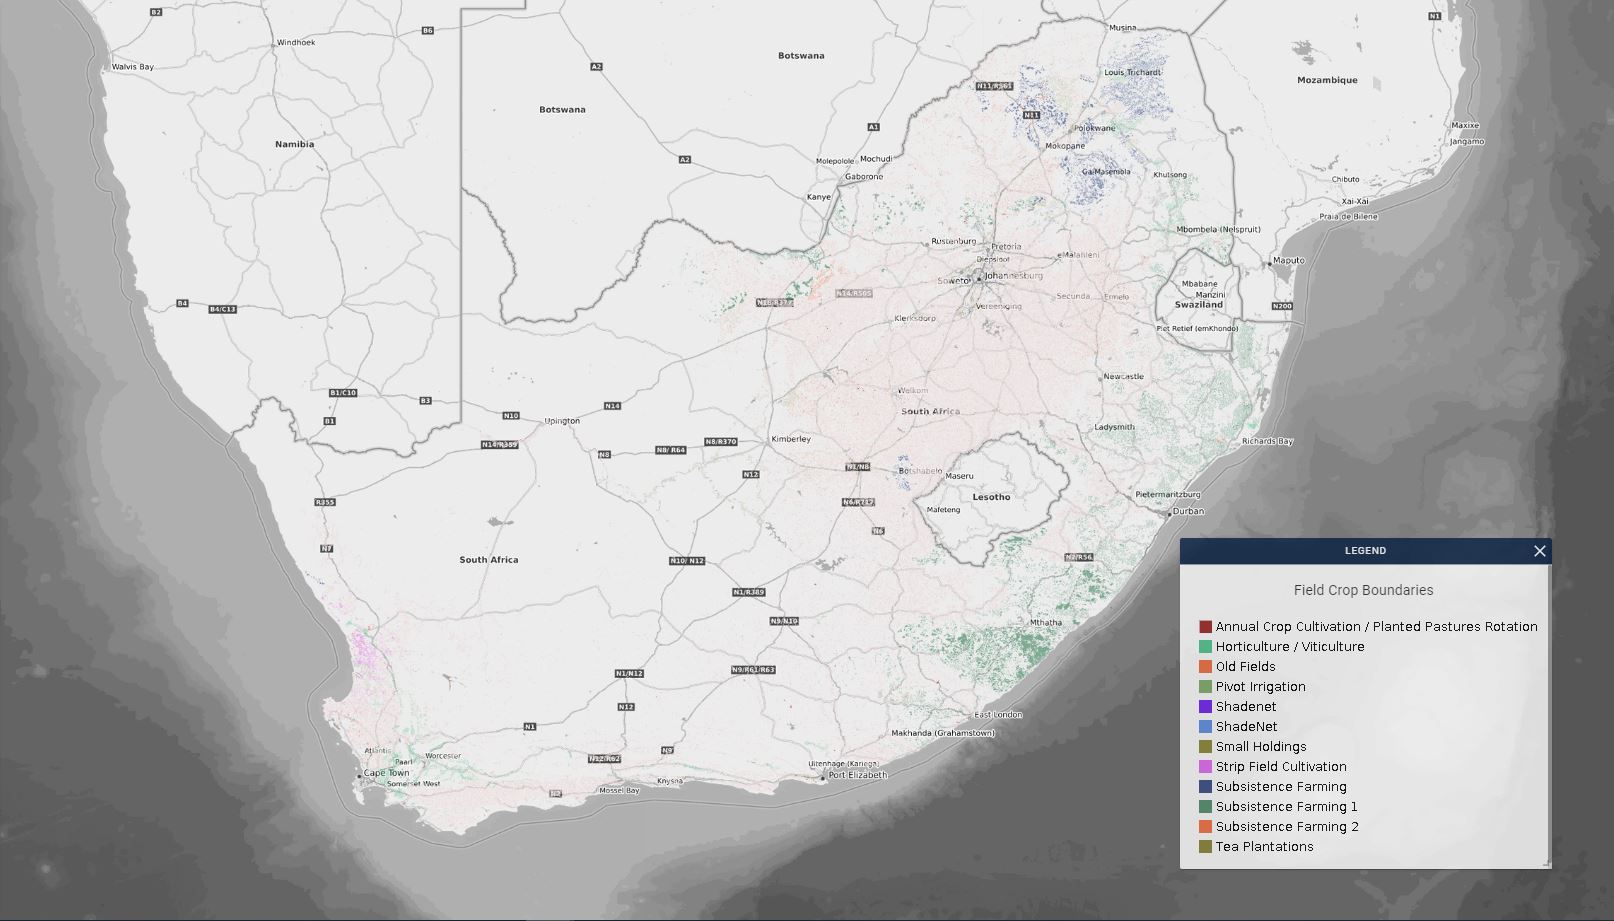
Figure 8: Crop production types of South Africa (DAFF, 2006)