Forestry residue

This case study investigates the potential for forestry residue  (stalk, bark, stem) to produce bioenergy in Mpumalanga and KwaZulu-Natal.

 Authors: Caroline Mfopa, Marc Pienaar

Overview

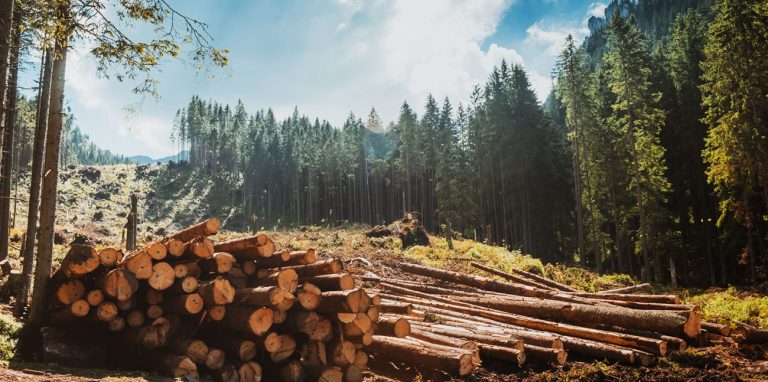
The forestry regions of South Africa cover 1.4 million hectares of land, predominantly along the eastern escarpment (approximately 1% of the country’s total surface area). The ownership pattern of South African forests is dominated by privately owned enterprises, which account for 79.7%  of forestry plantations nationwide.  Private industry forestry owners include large corporations, small-scale growers, and medium-scale growers. The remaining 18% of farms are owned by the government and public sector, through the Department of Agriculture Forestry and Fisheries (DAFF) and other government agencies and a small percentage of forests (~2.3%) have unknown ownership.

The dominant cultivated tree species are members of the eucalyptus family as well as pinus spp. with some areas including various acacia spp. Forestry regions typically include commercial wood plantations or tree farms interspersed with non-commercial areas which include grasslands, wetlands, and indigenous forests. Non-commercial areas serve a dual purpose in that they maintain biodiversity and ecosystem function while also serving as fire breaks. South Africa has one of the highest levels of forest certification in the world, with the Forest Stewardship Council (FSC) certifying over 80% of the country’s wood plantations (Forestry South Africa, 2021).

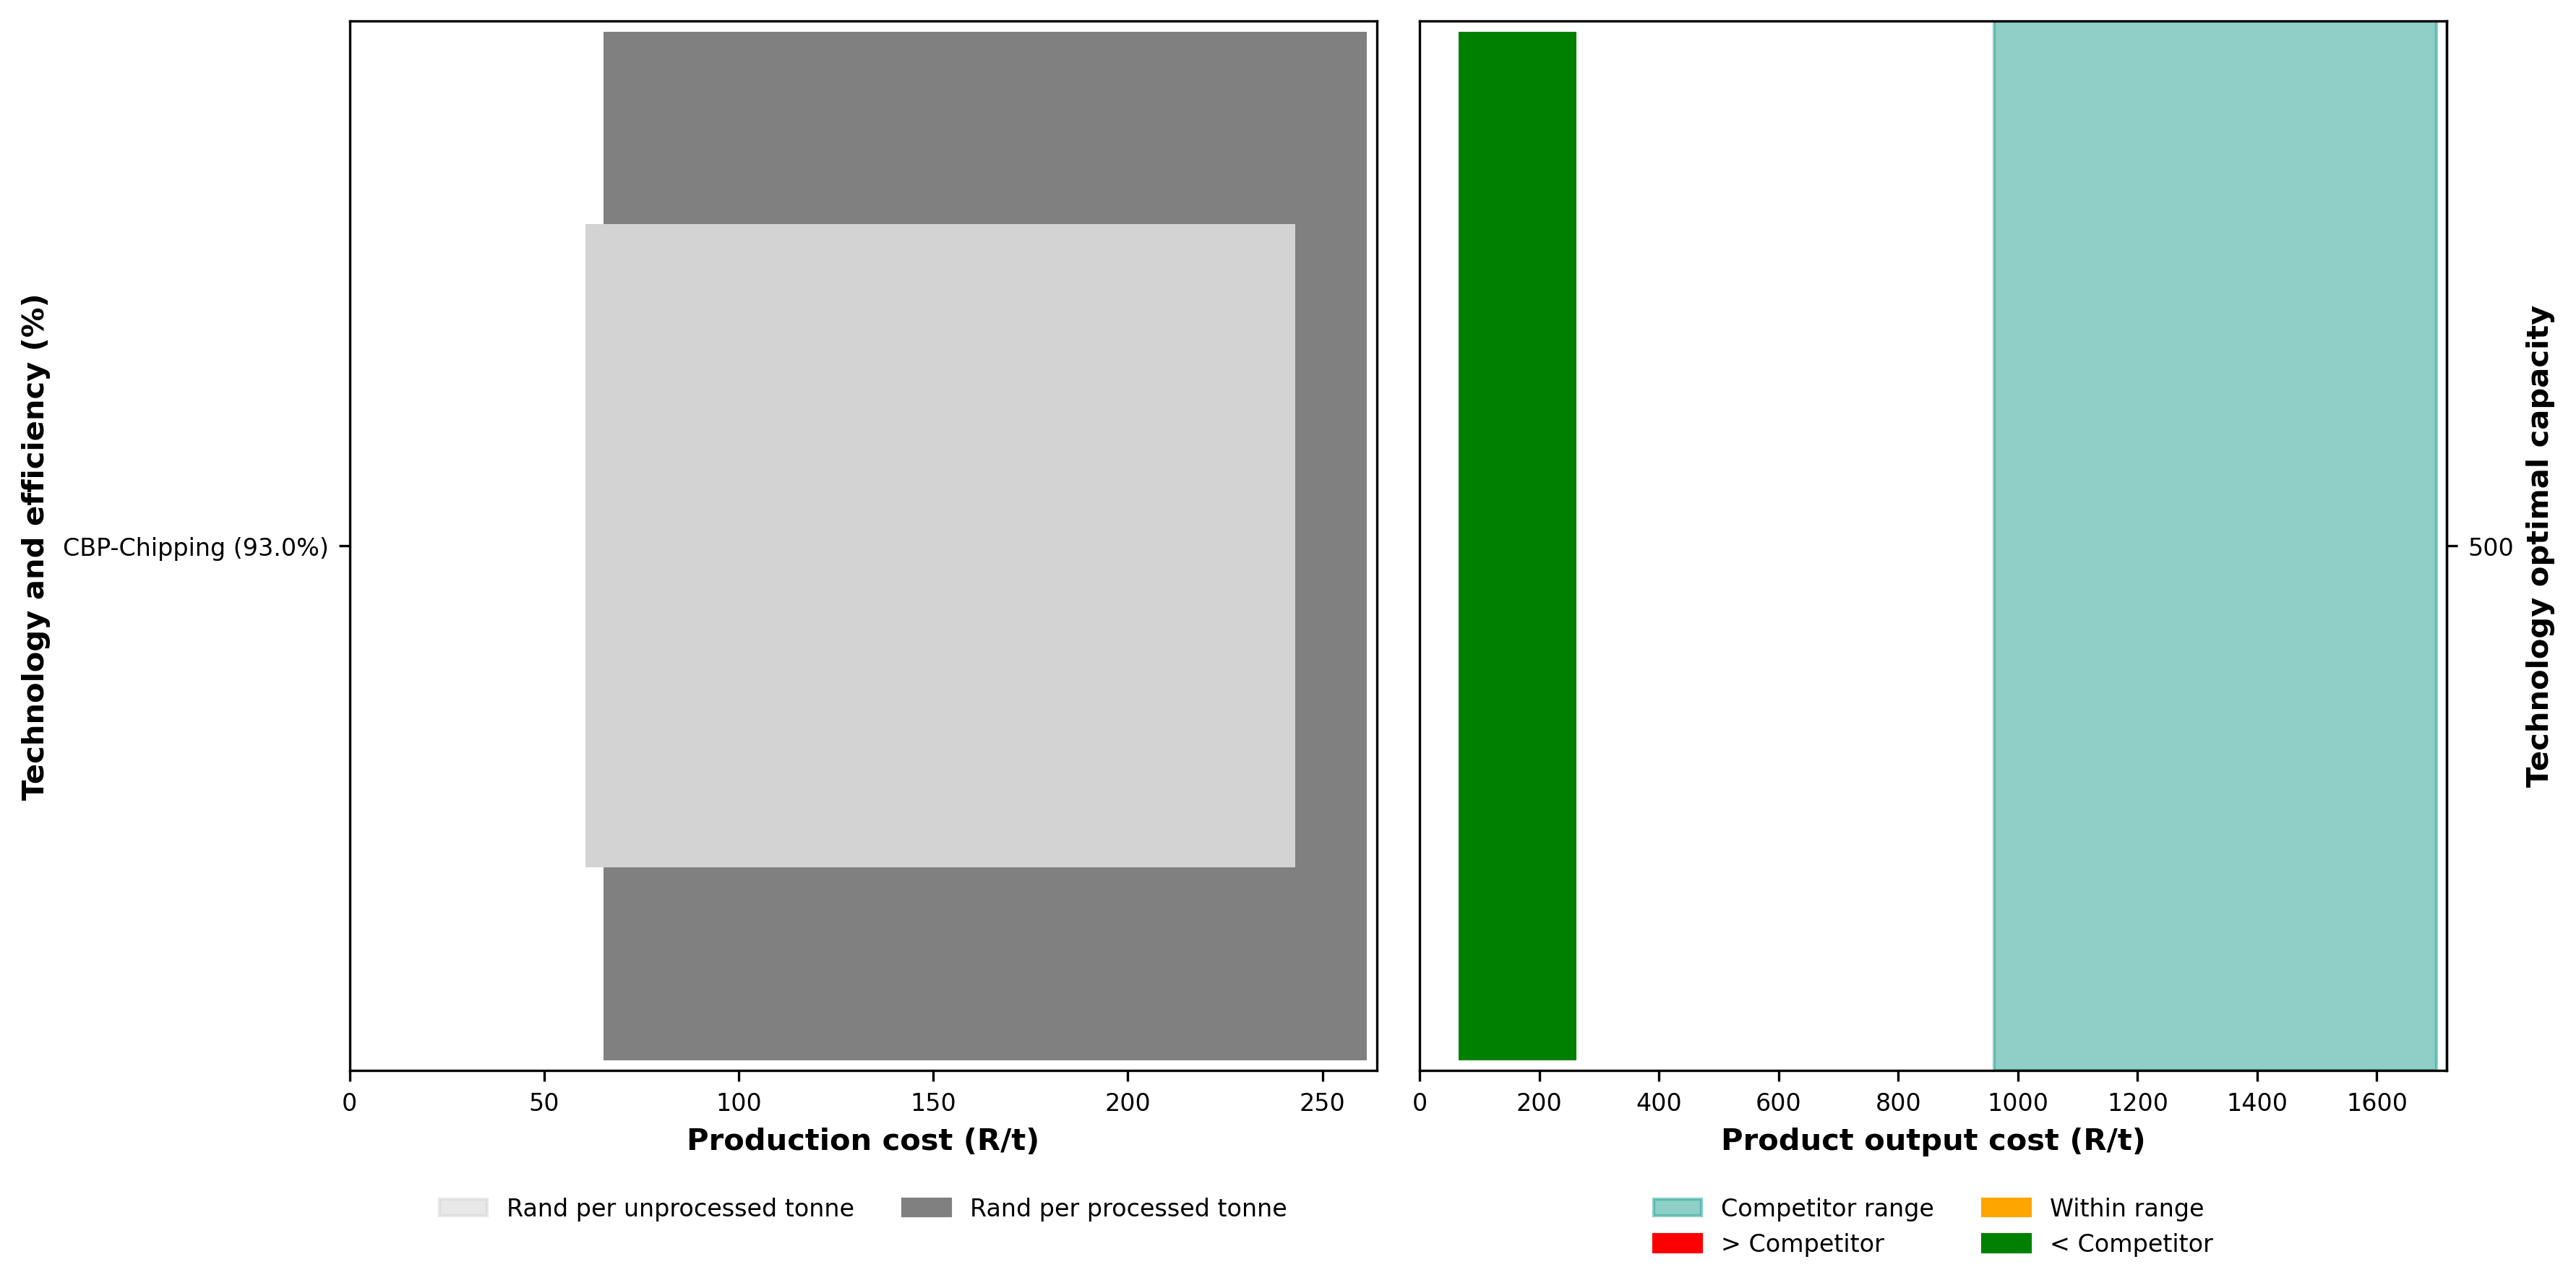
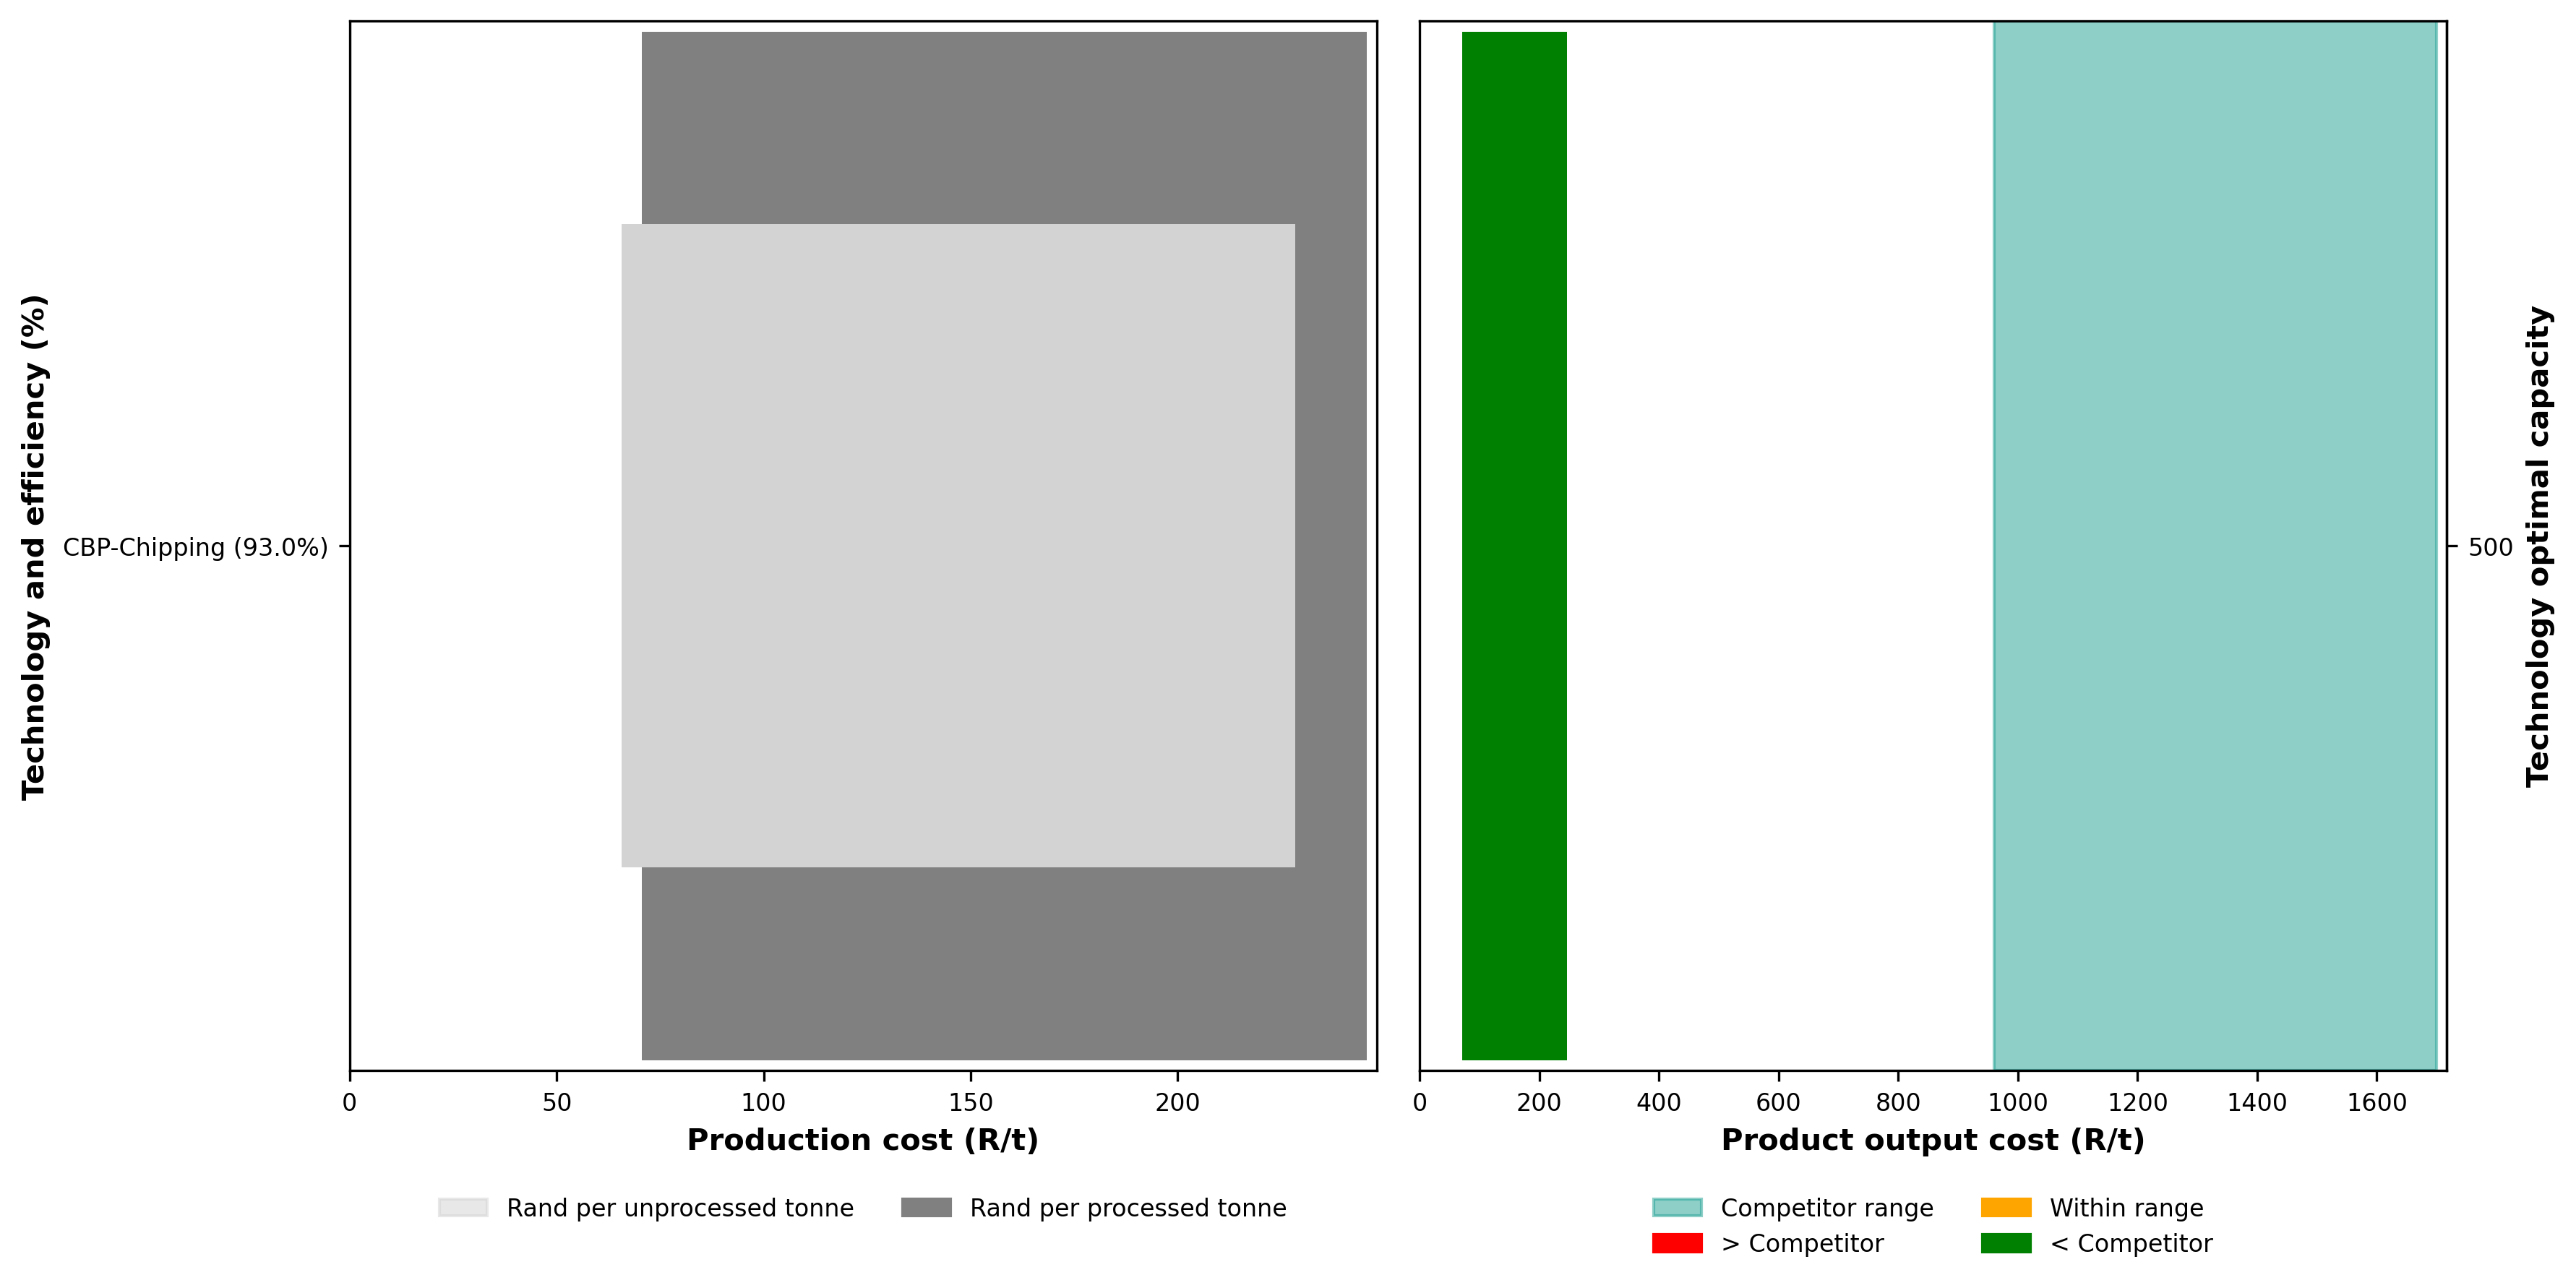
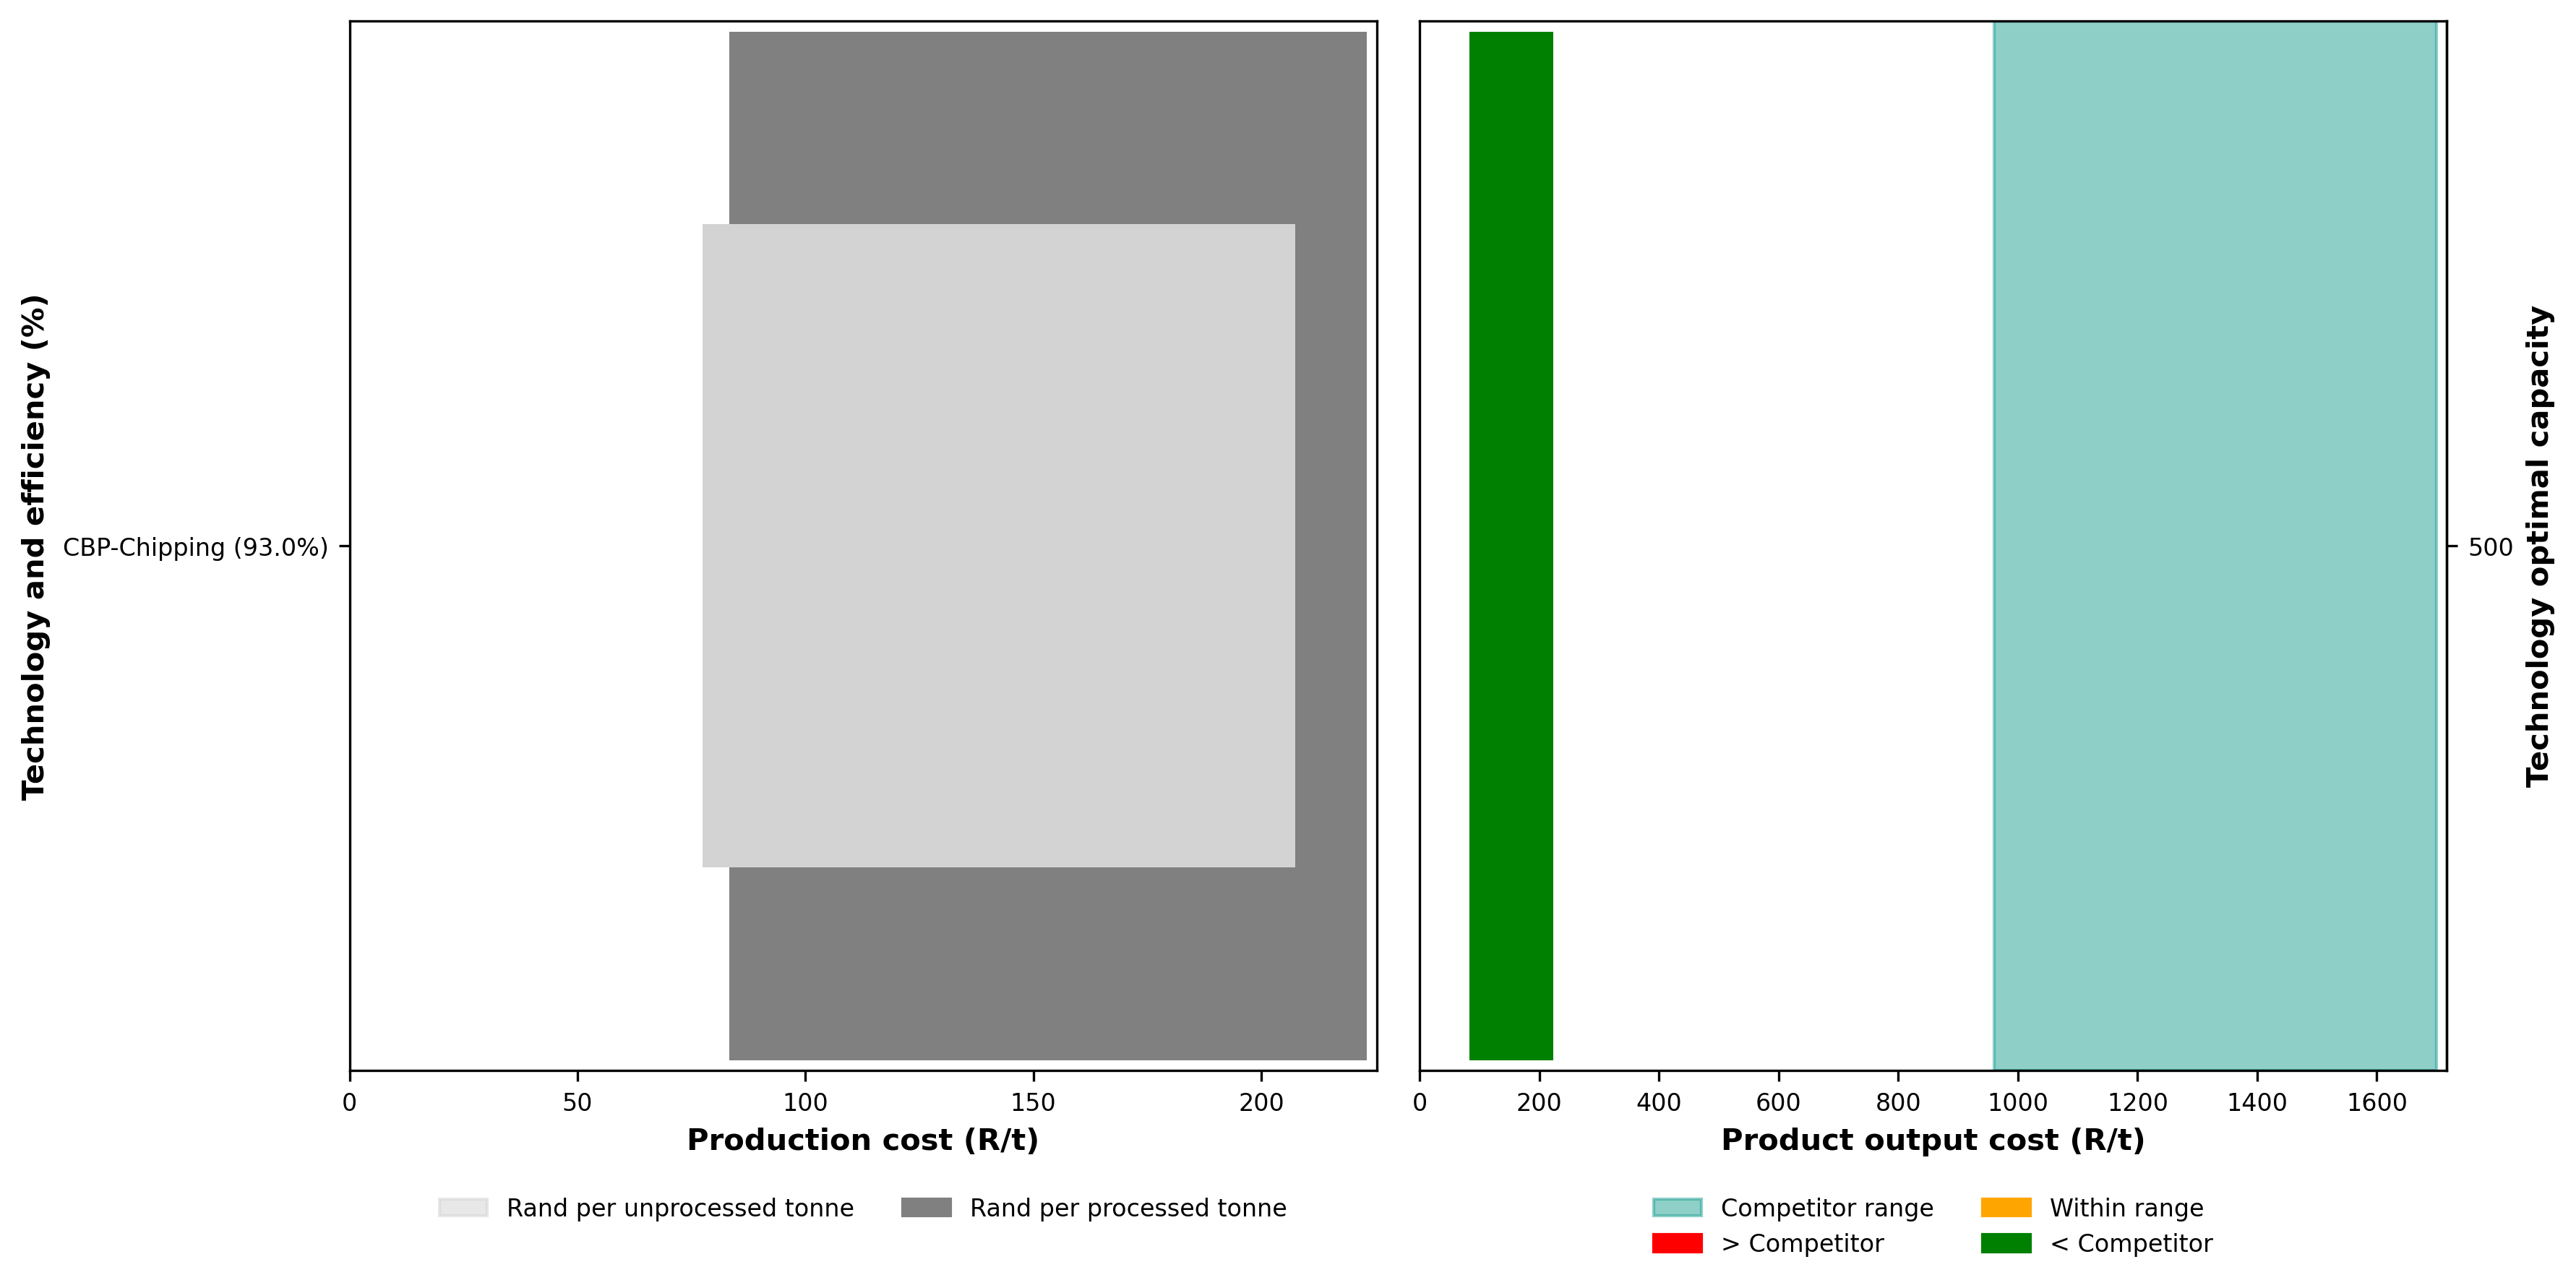
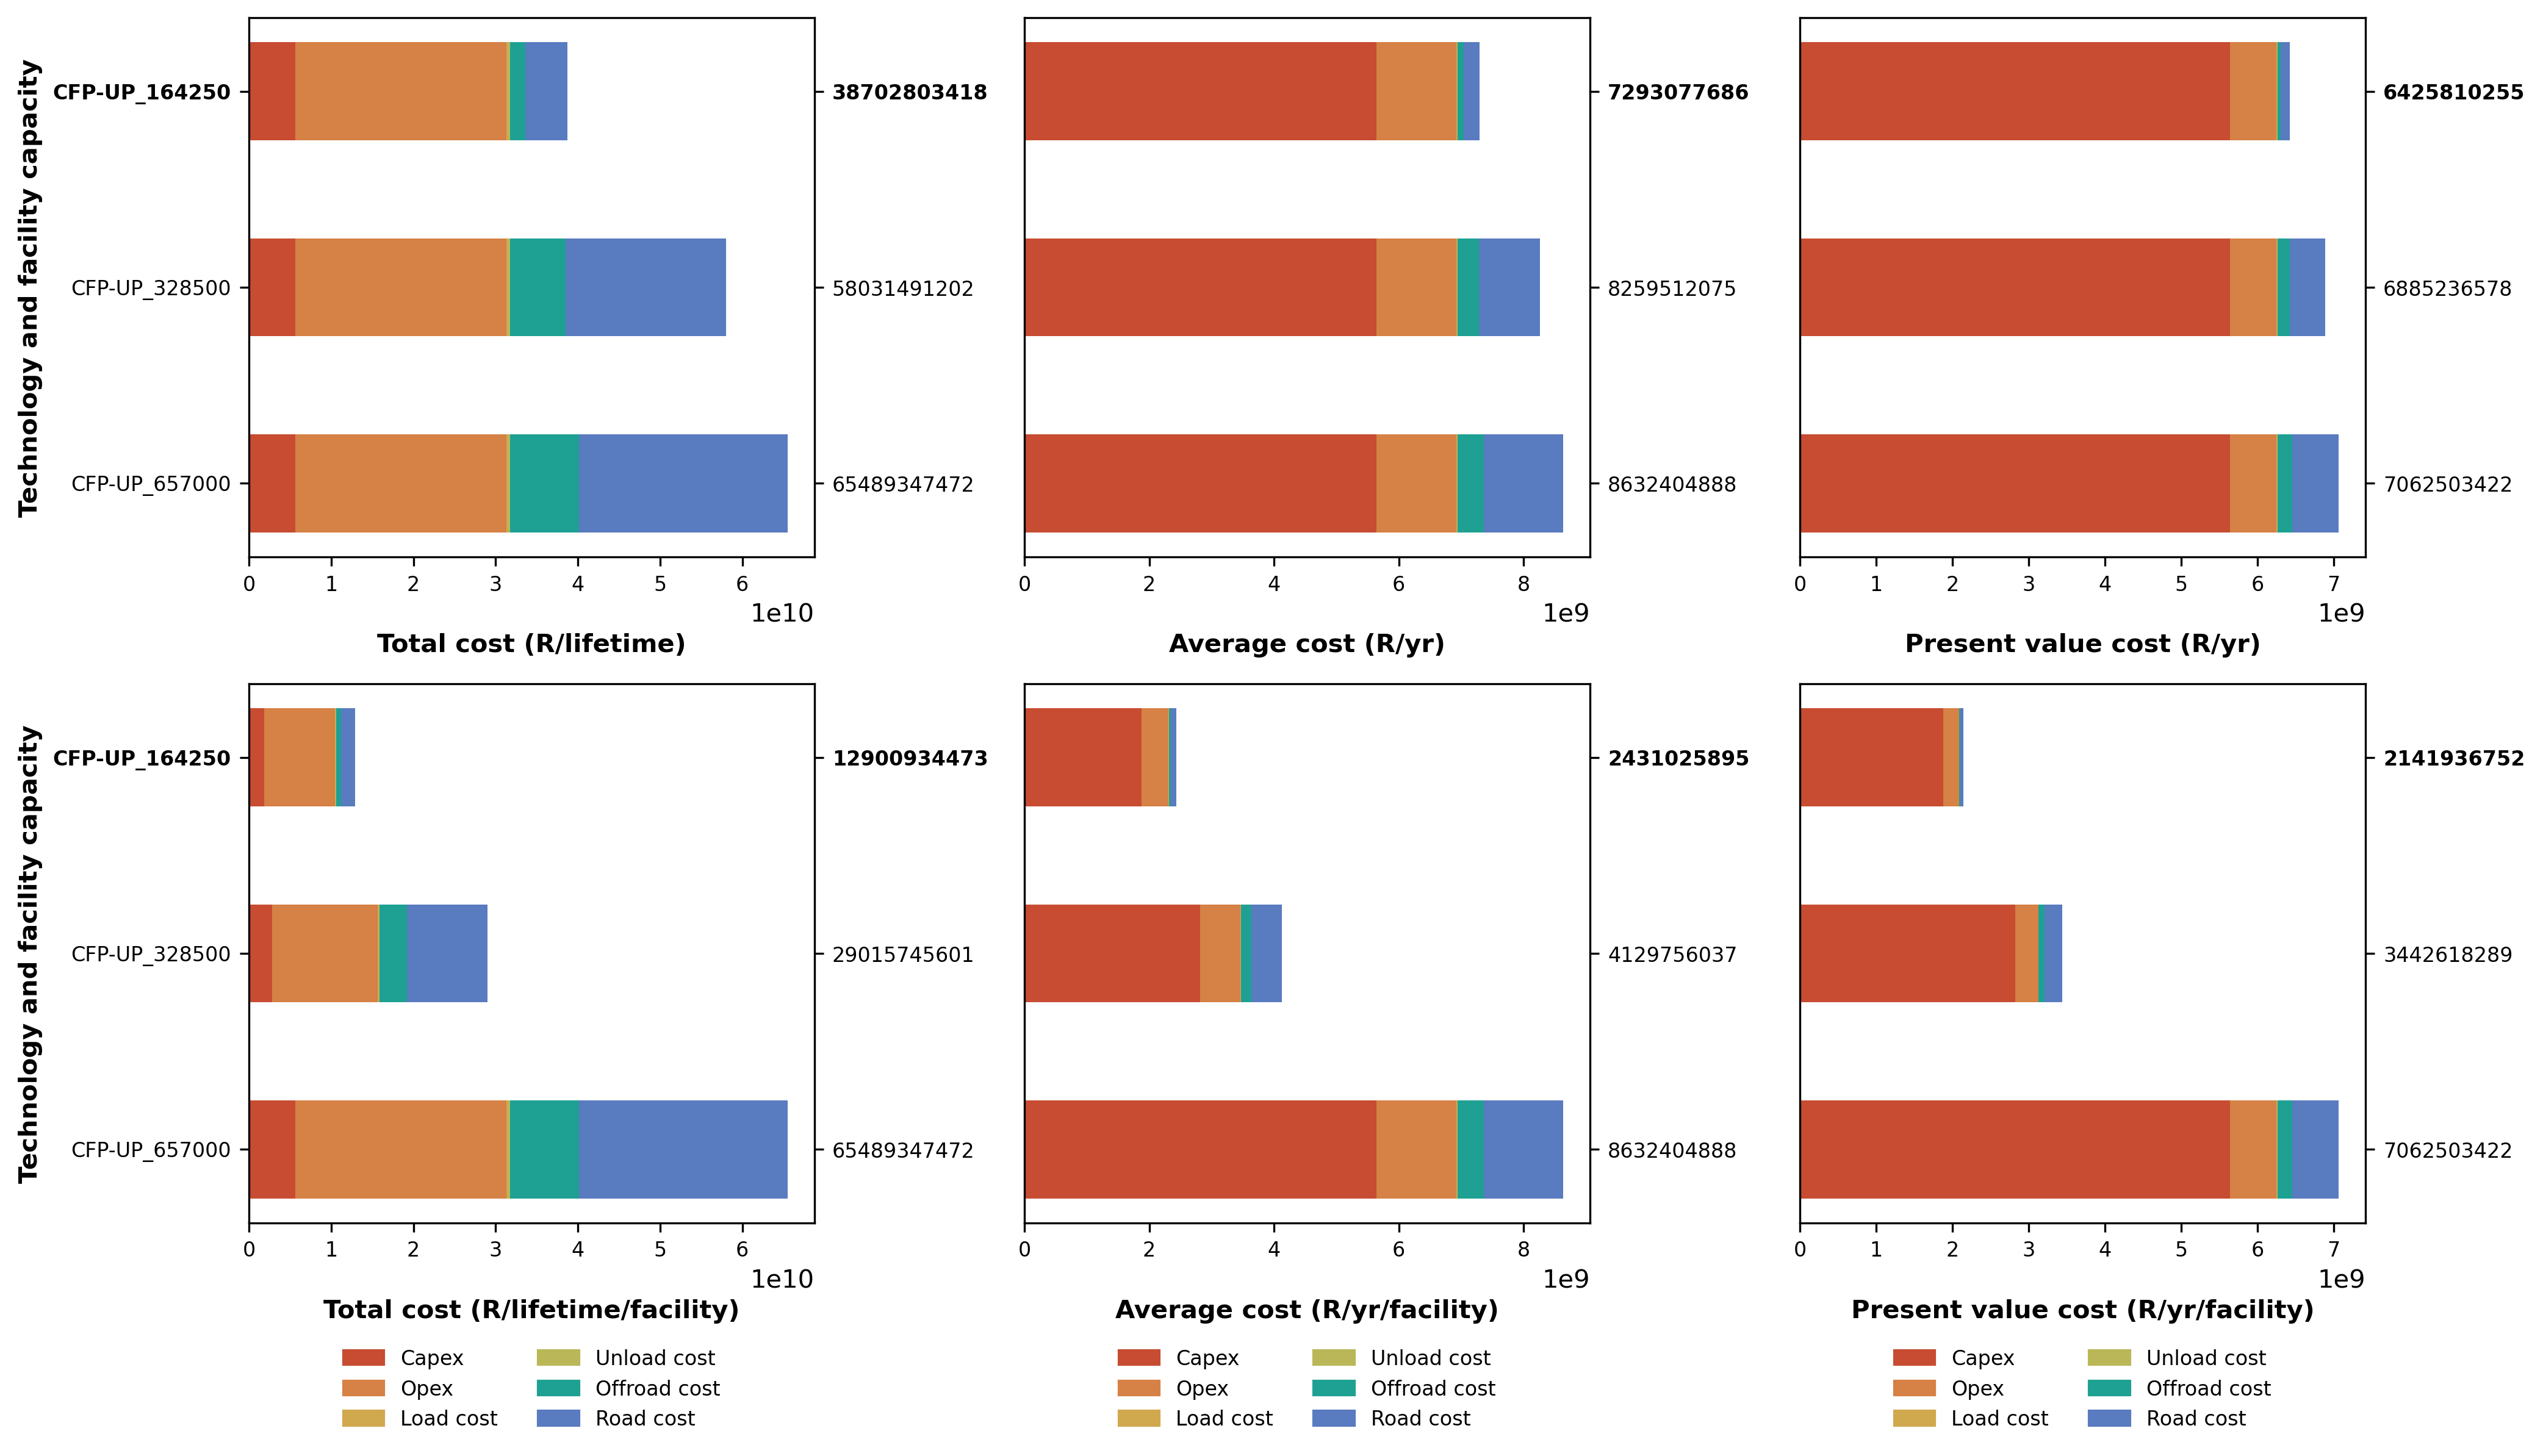
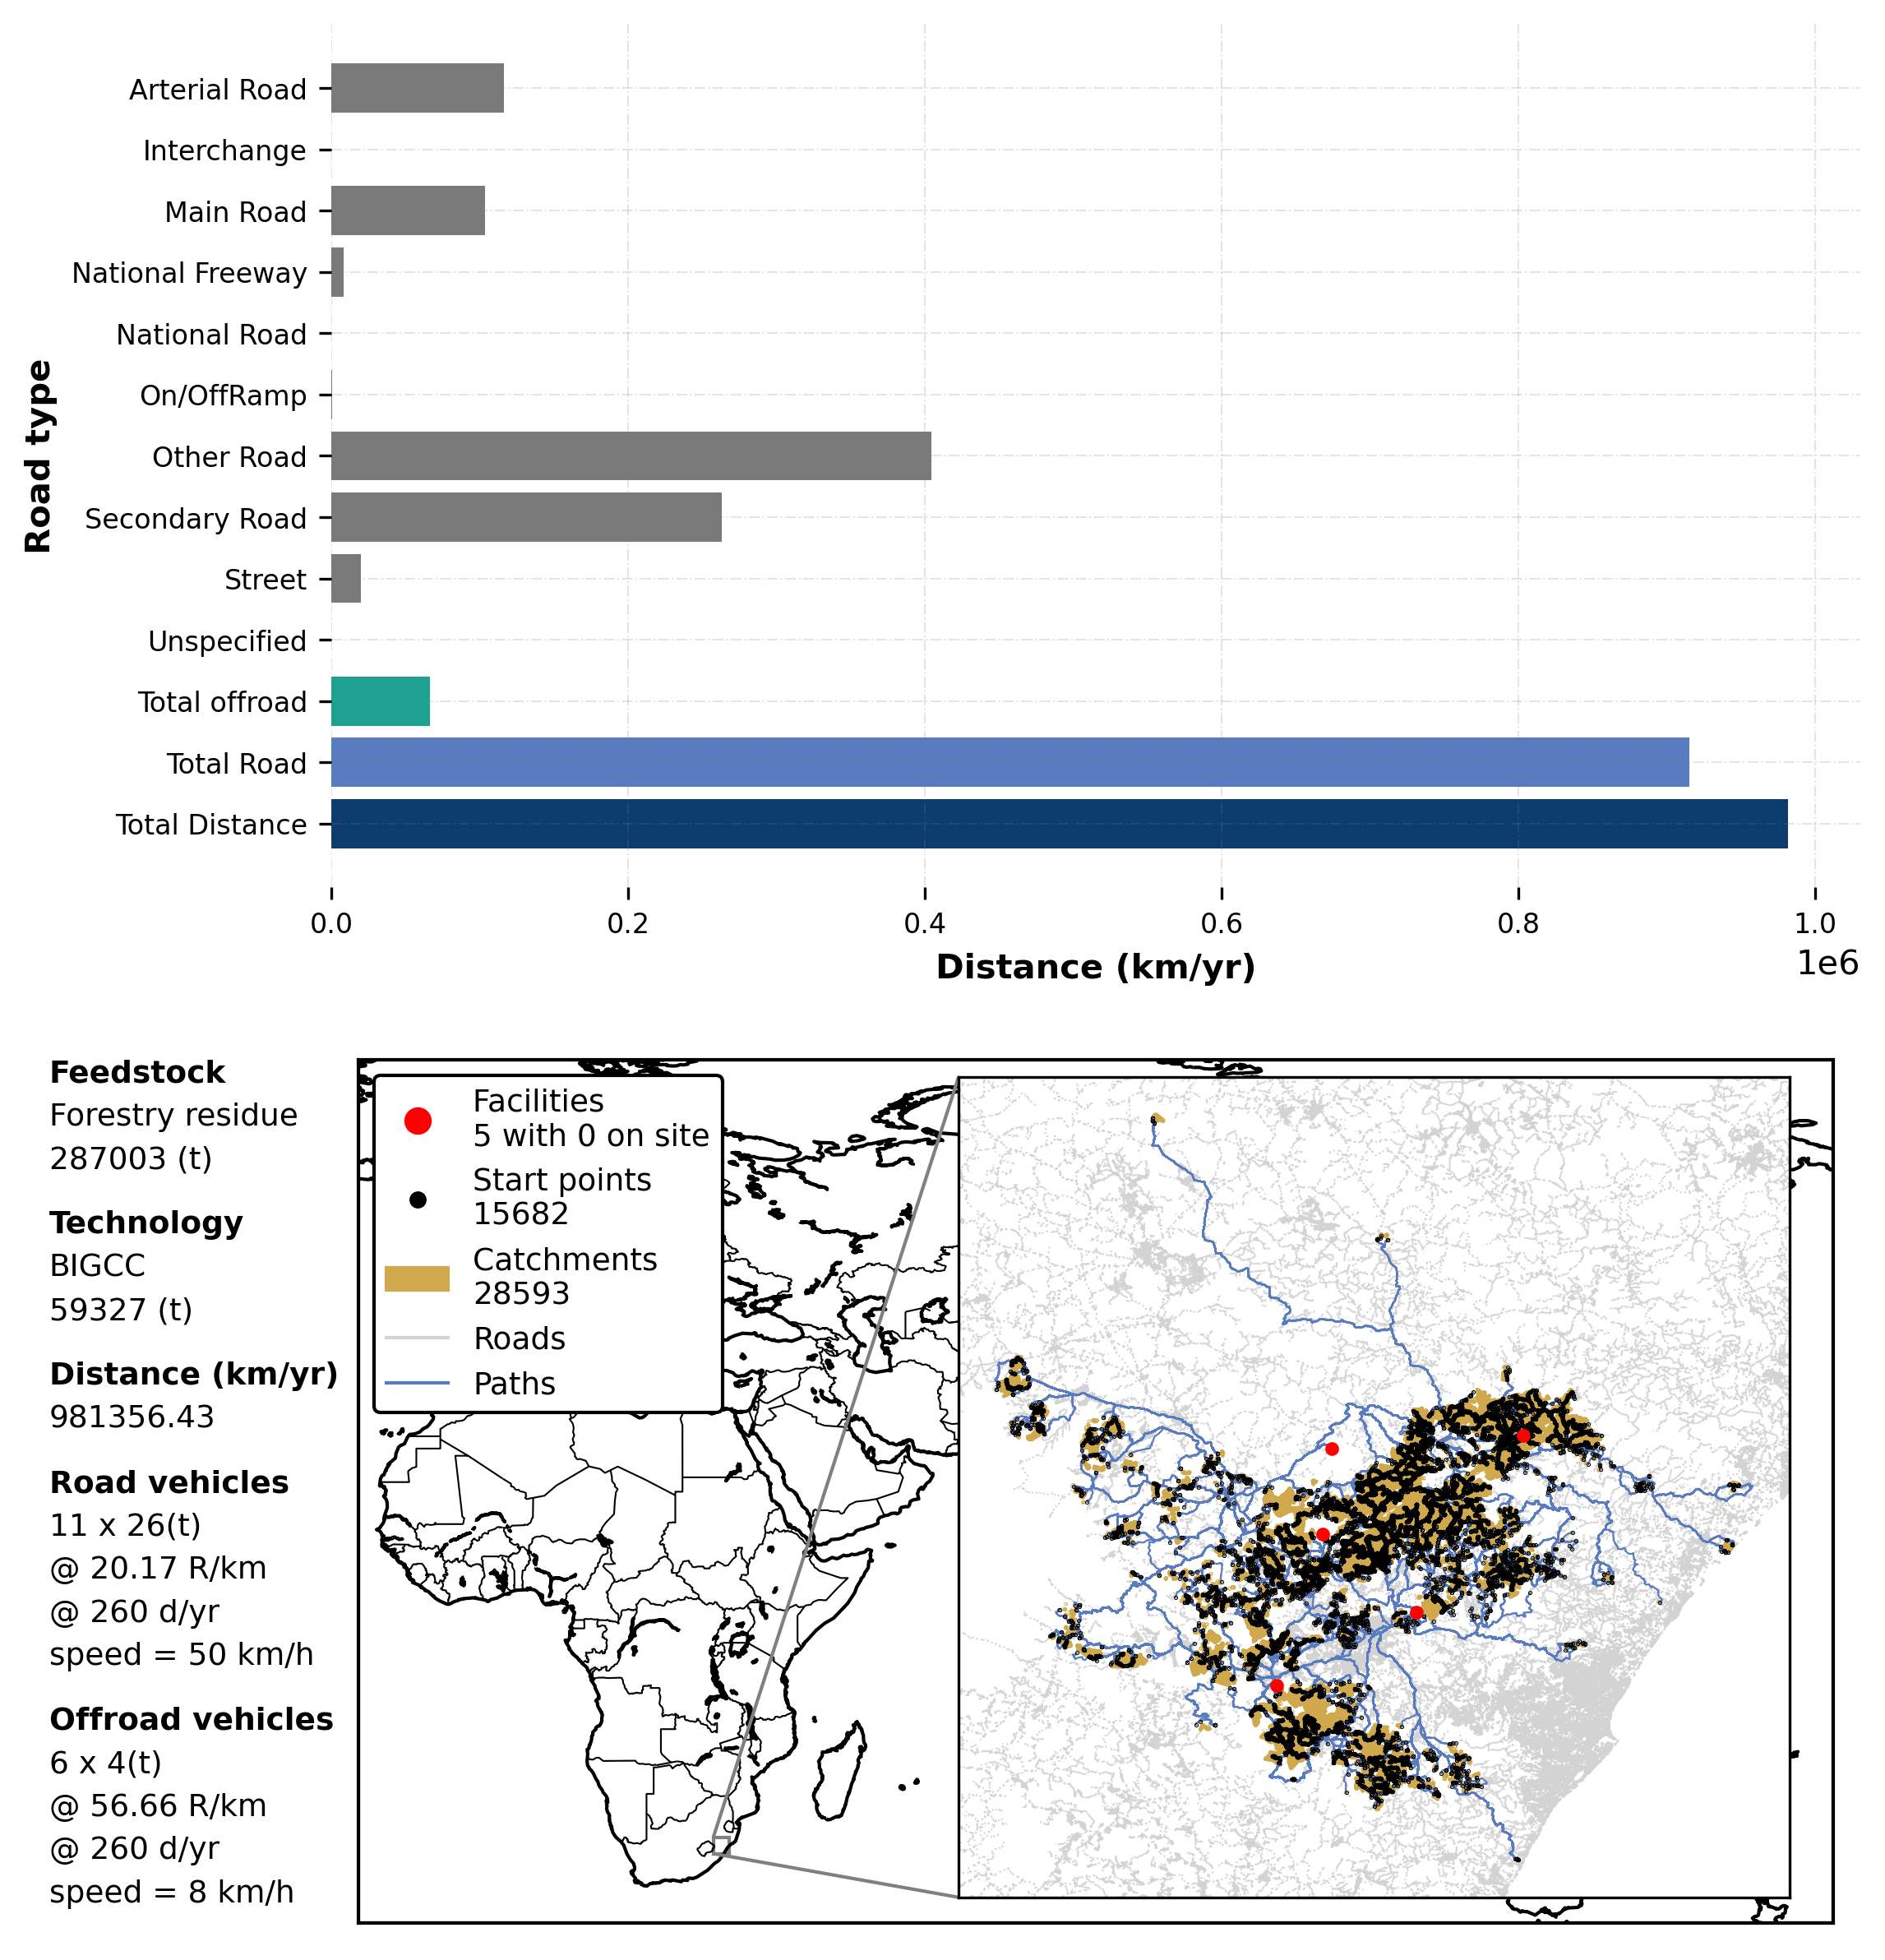
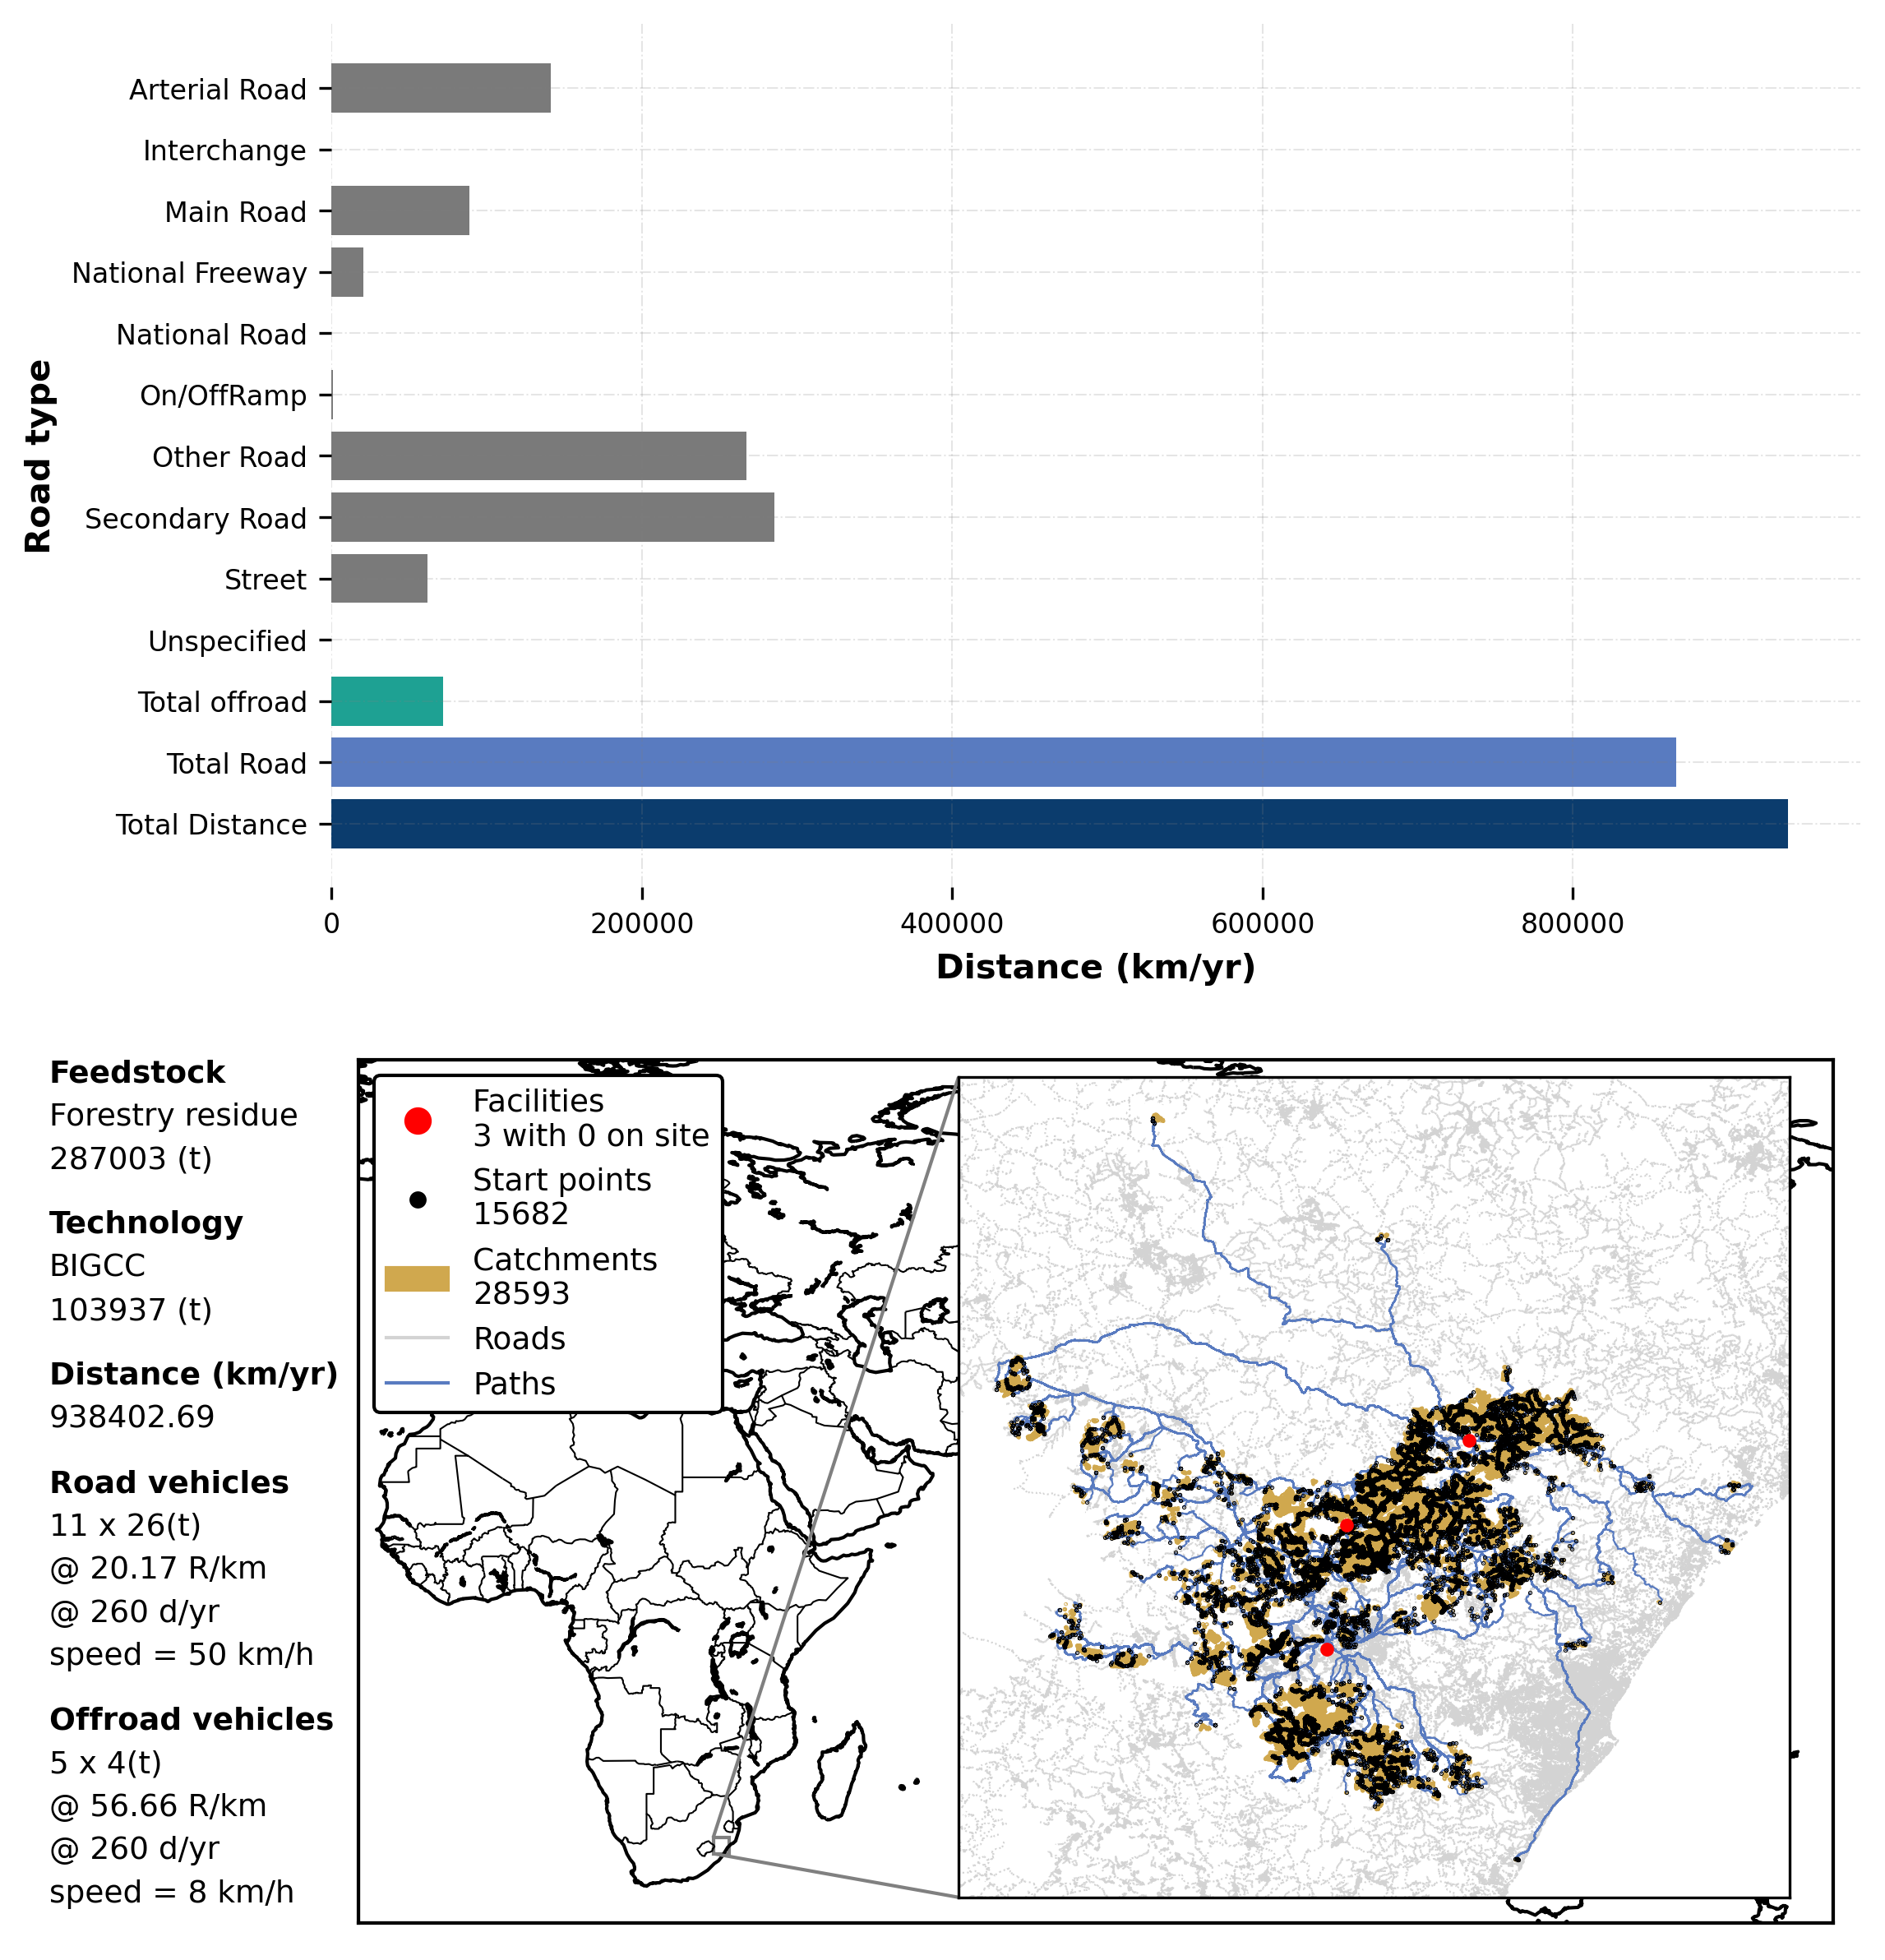
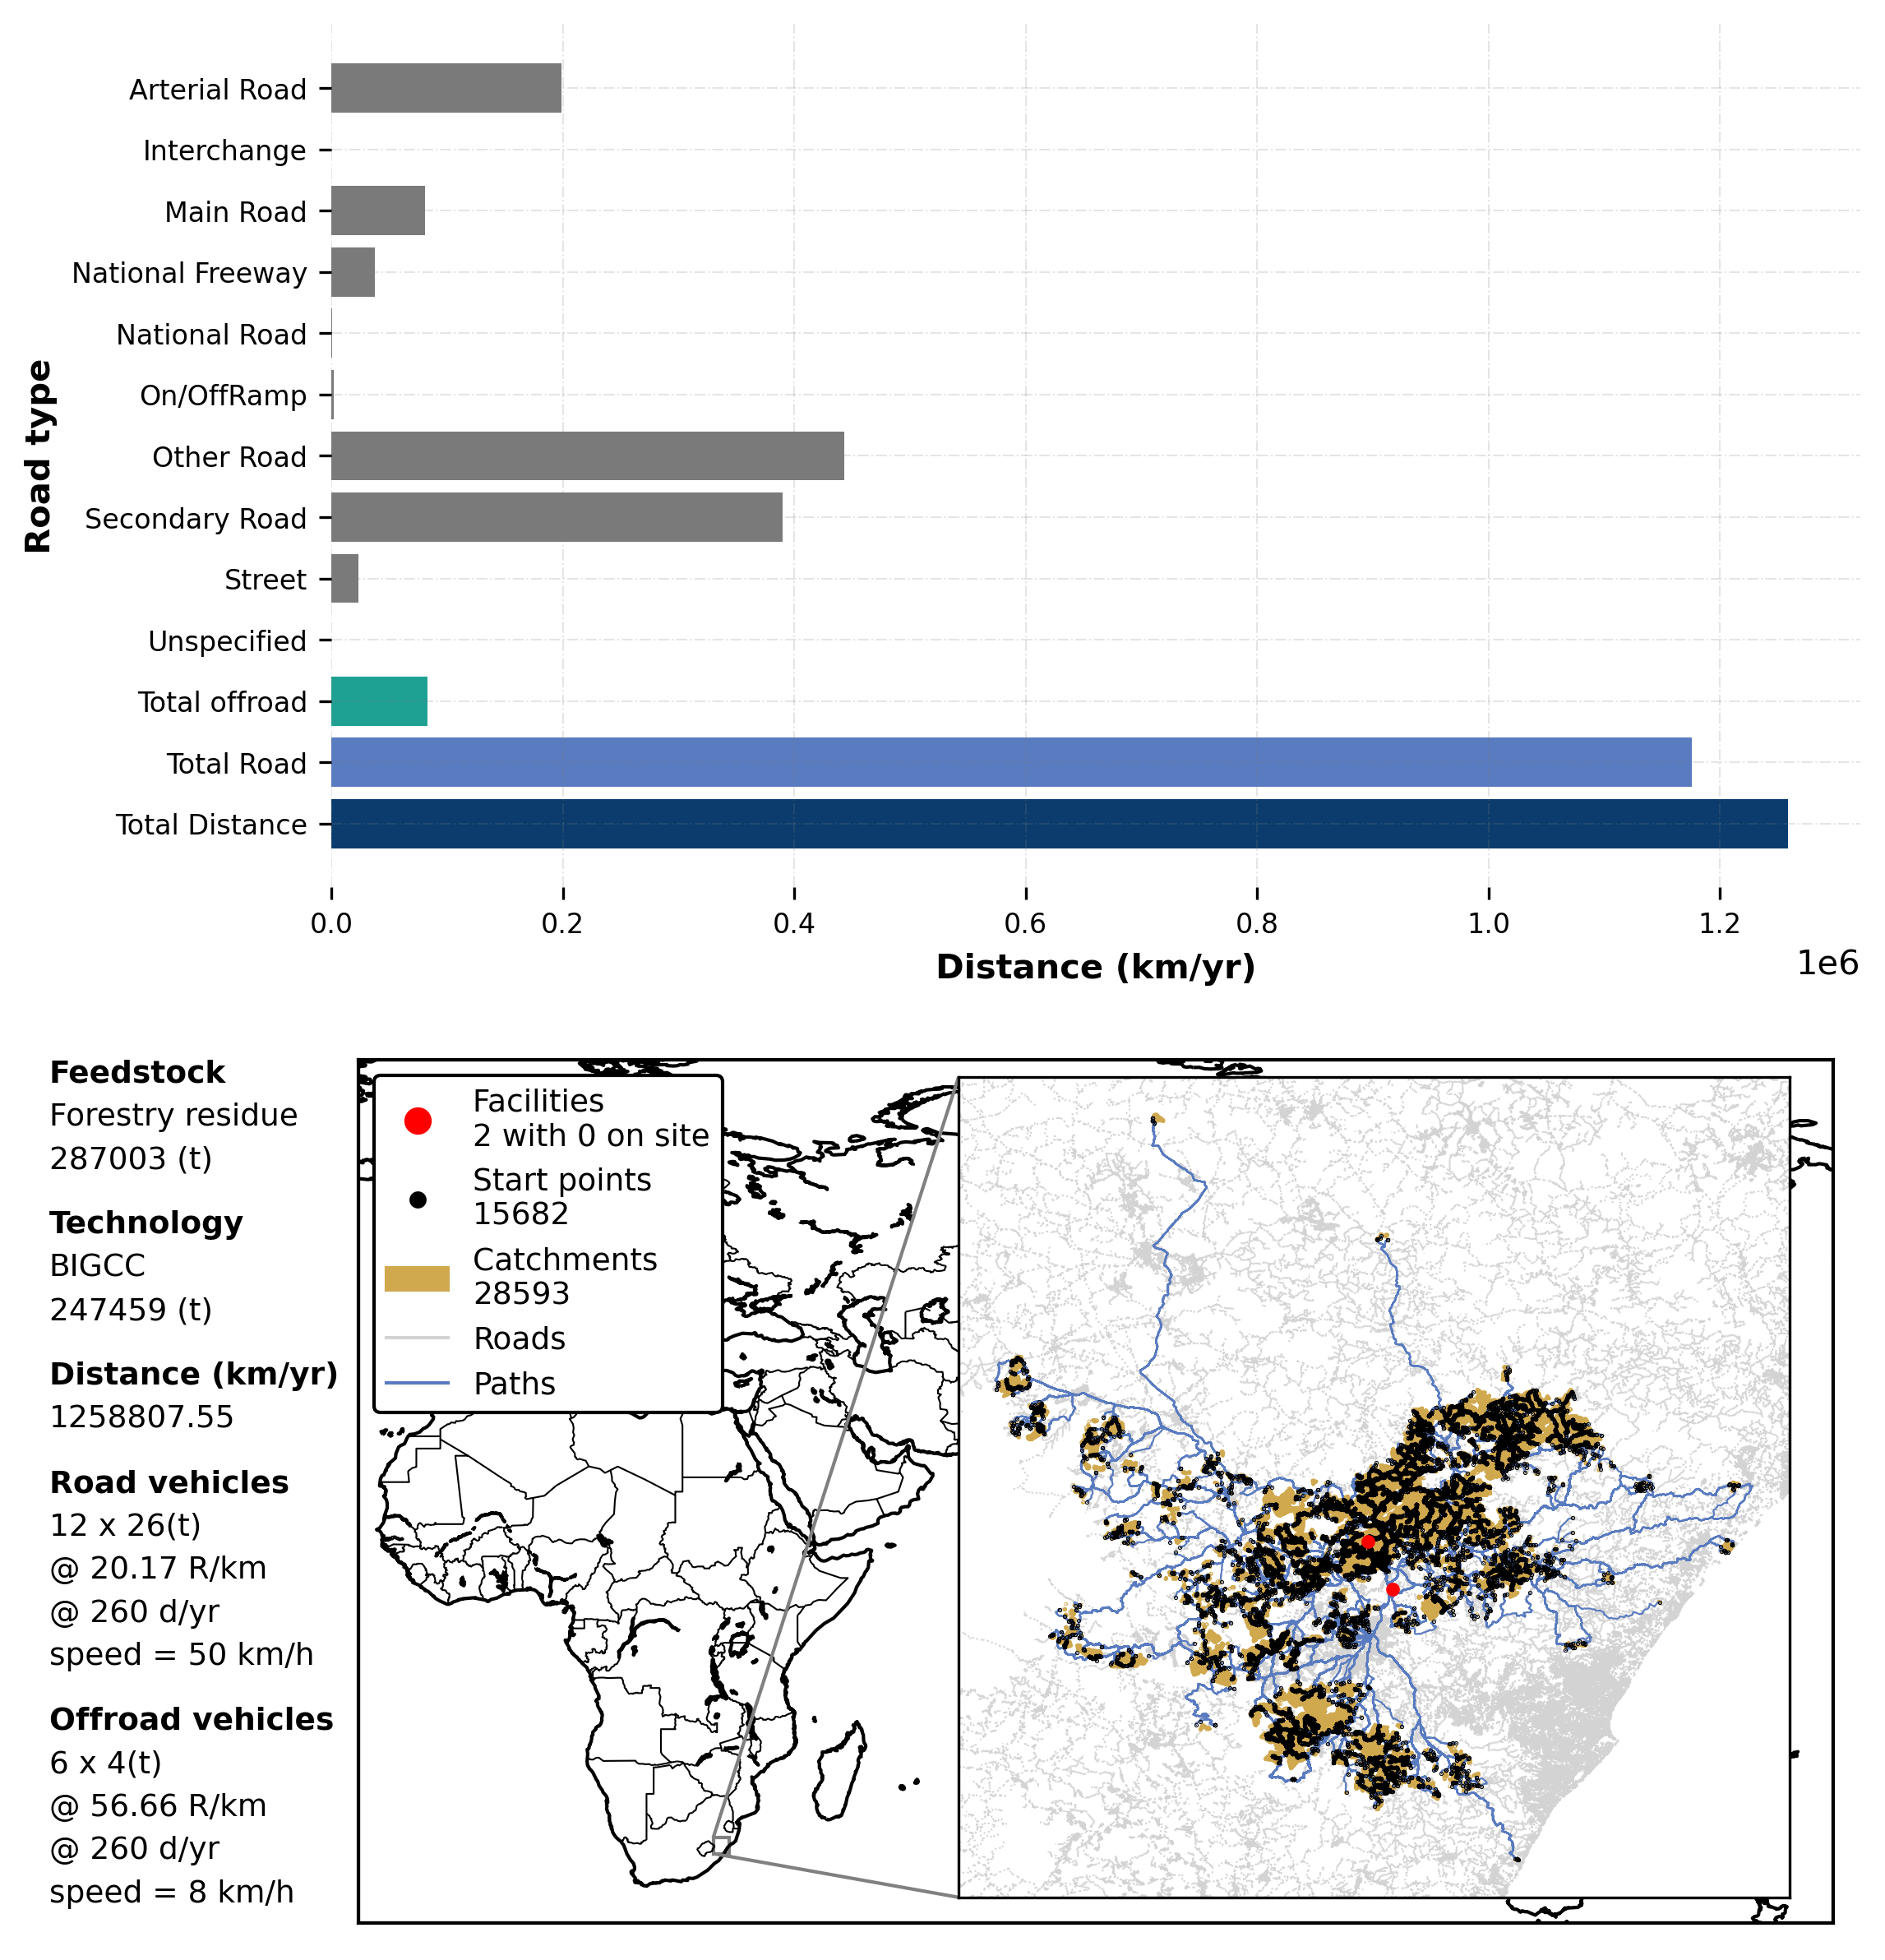
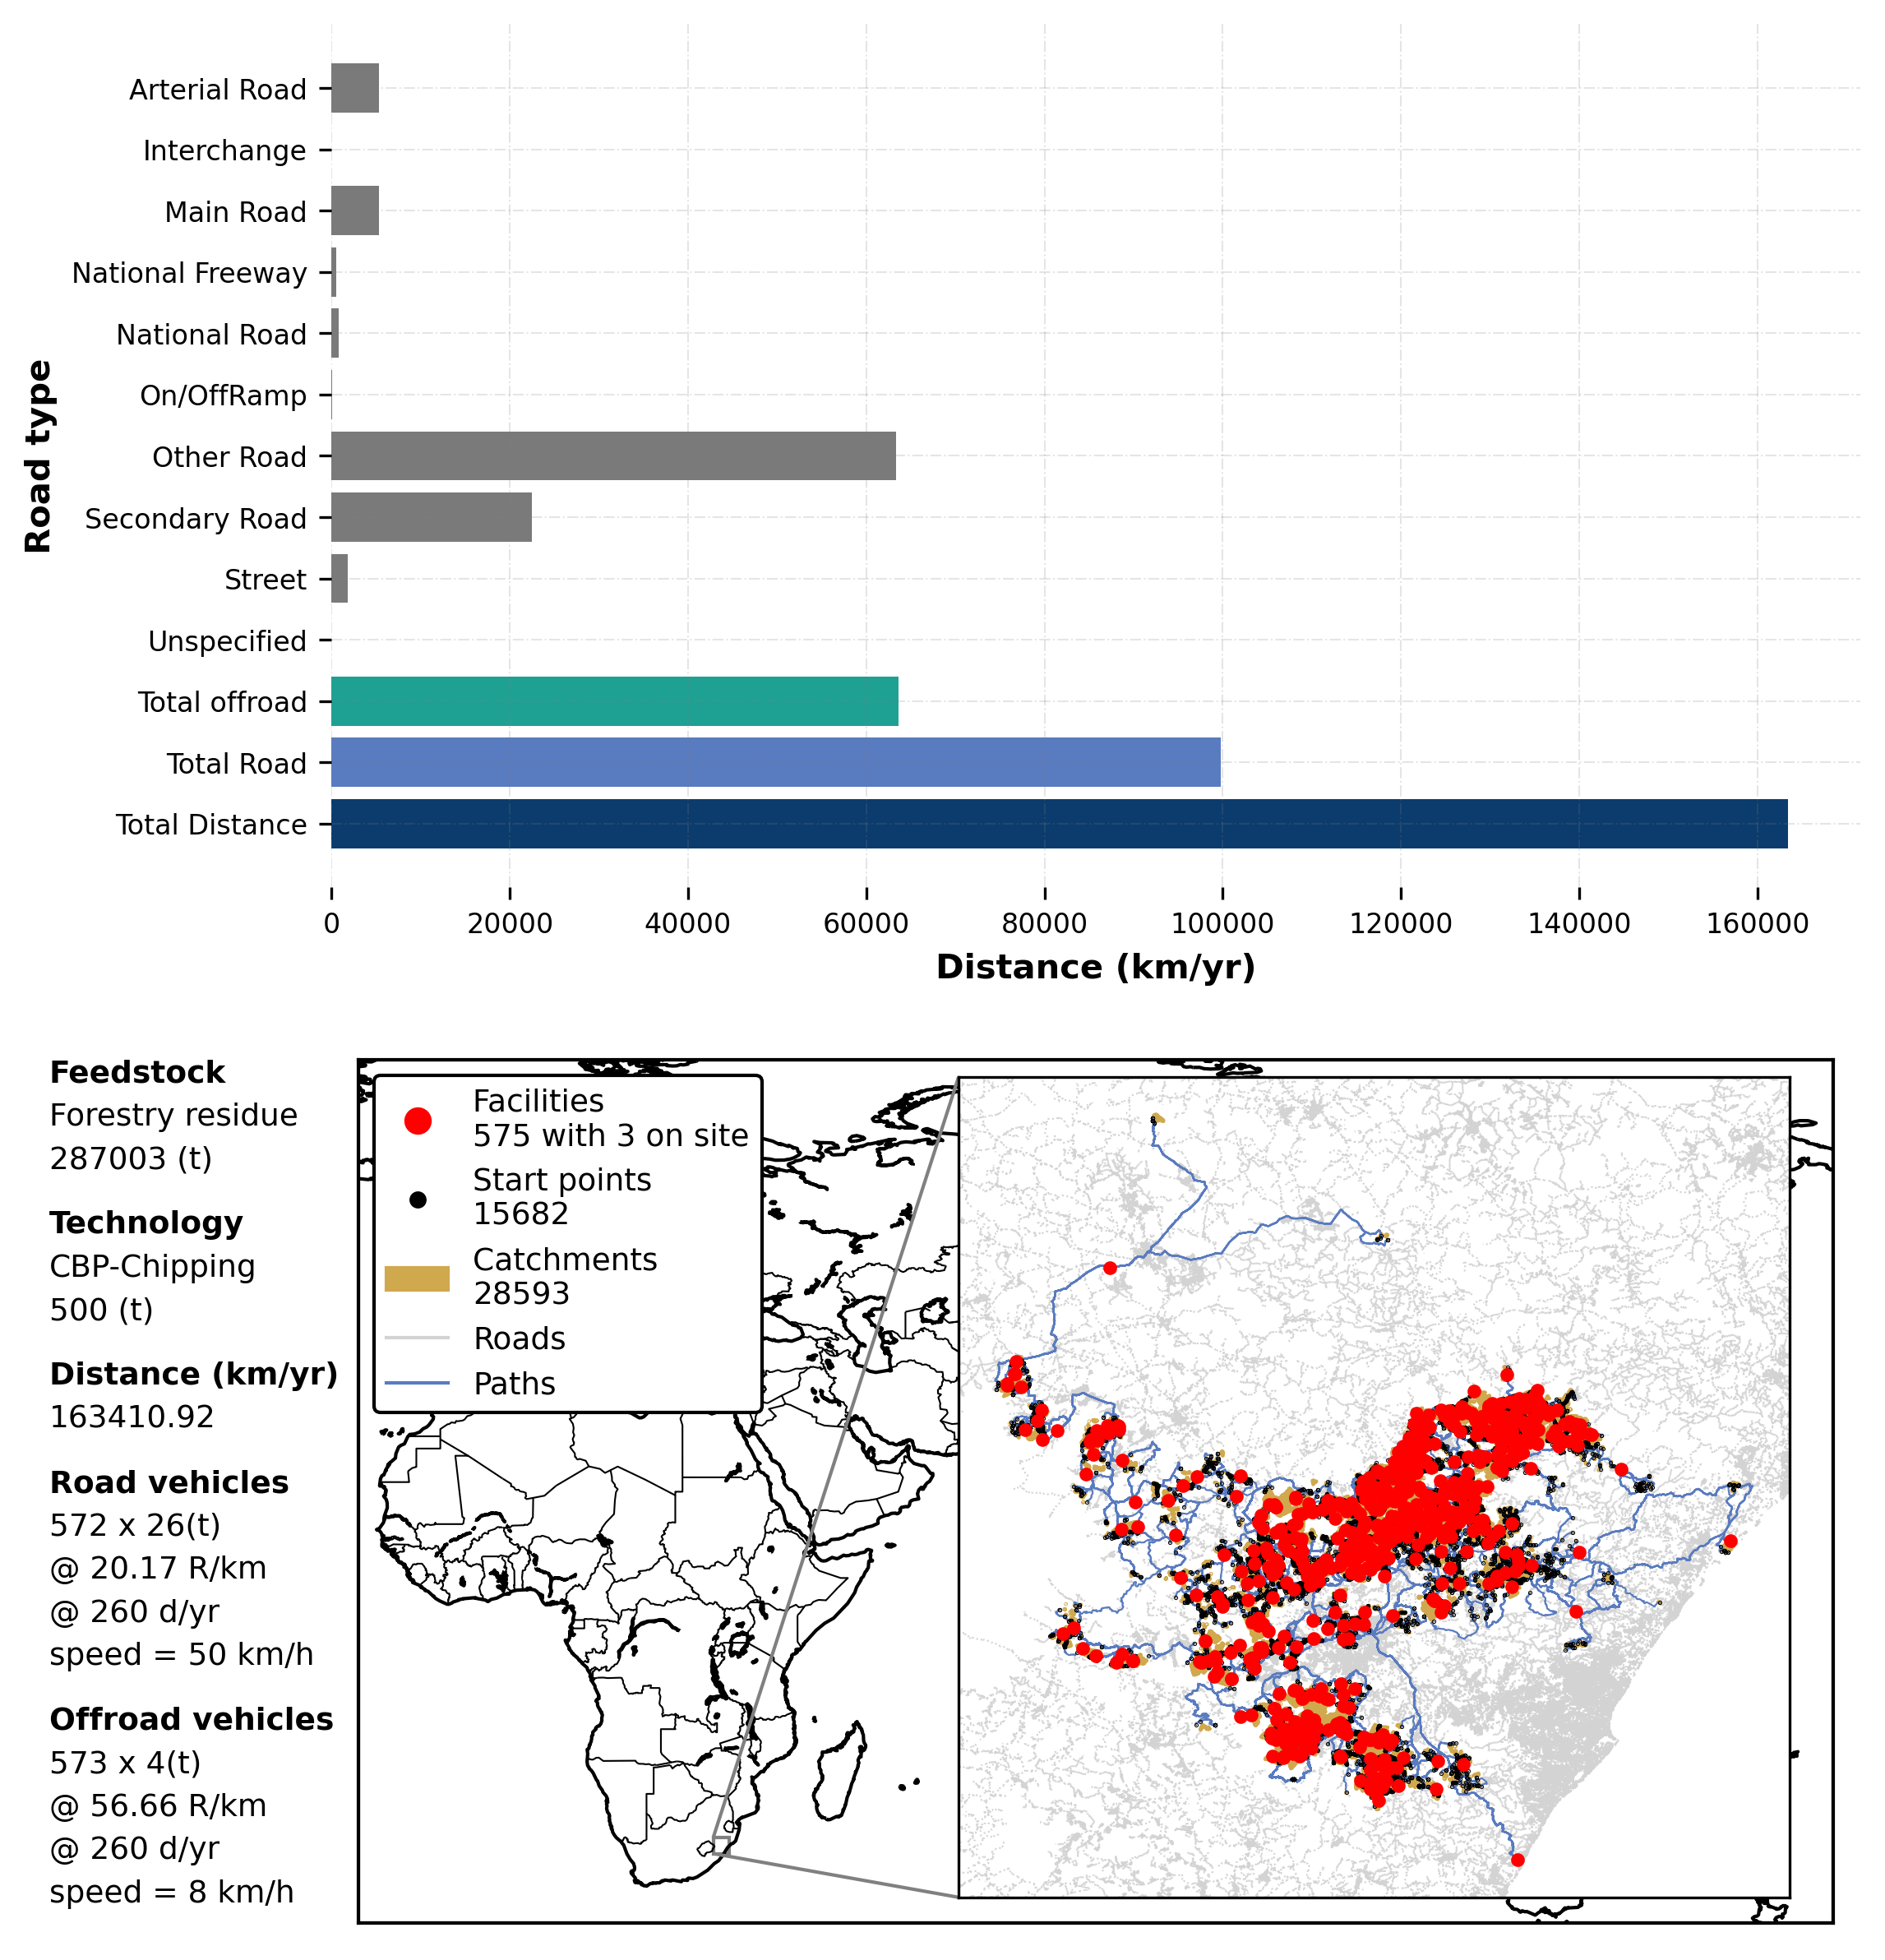
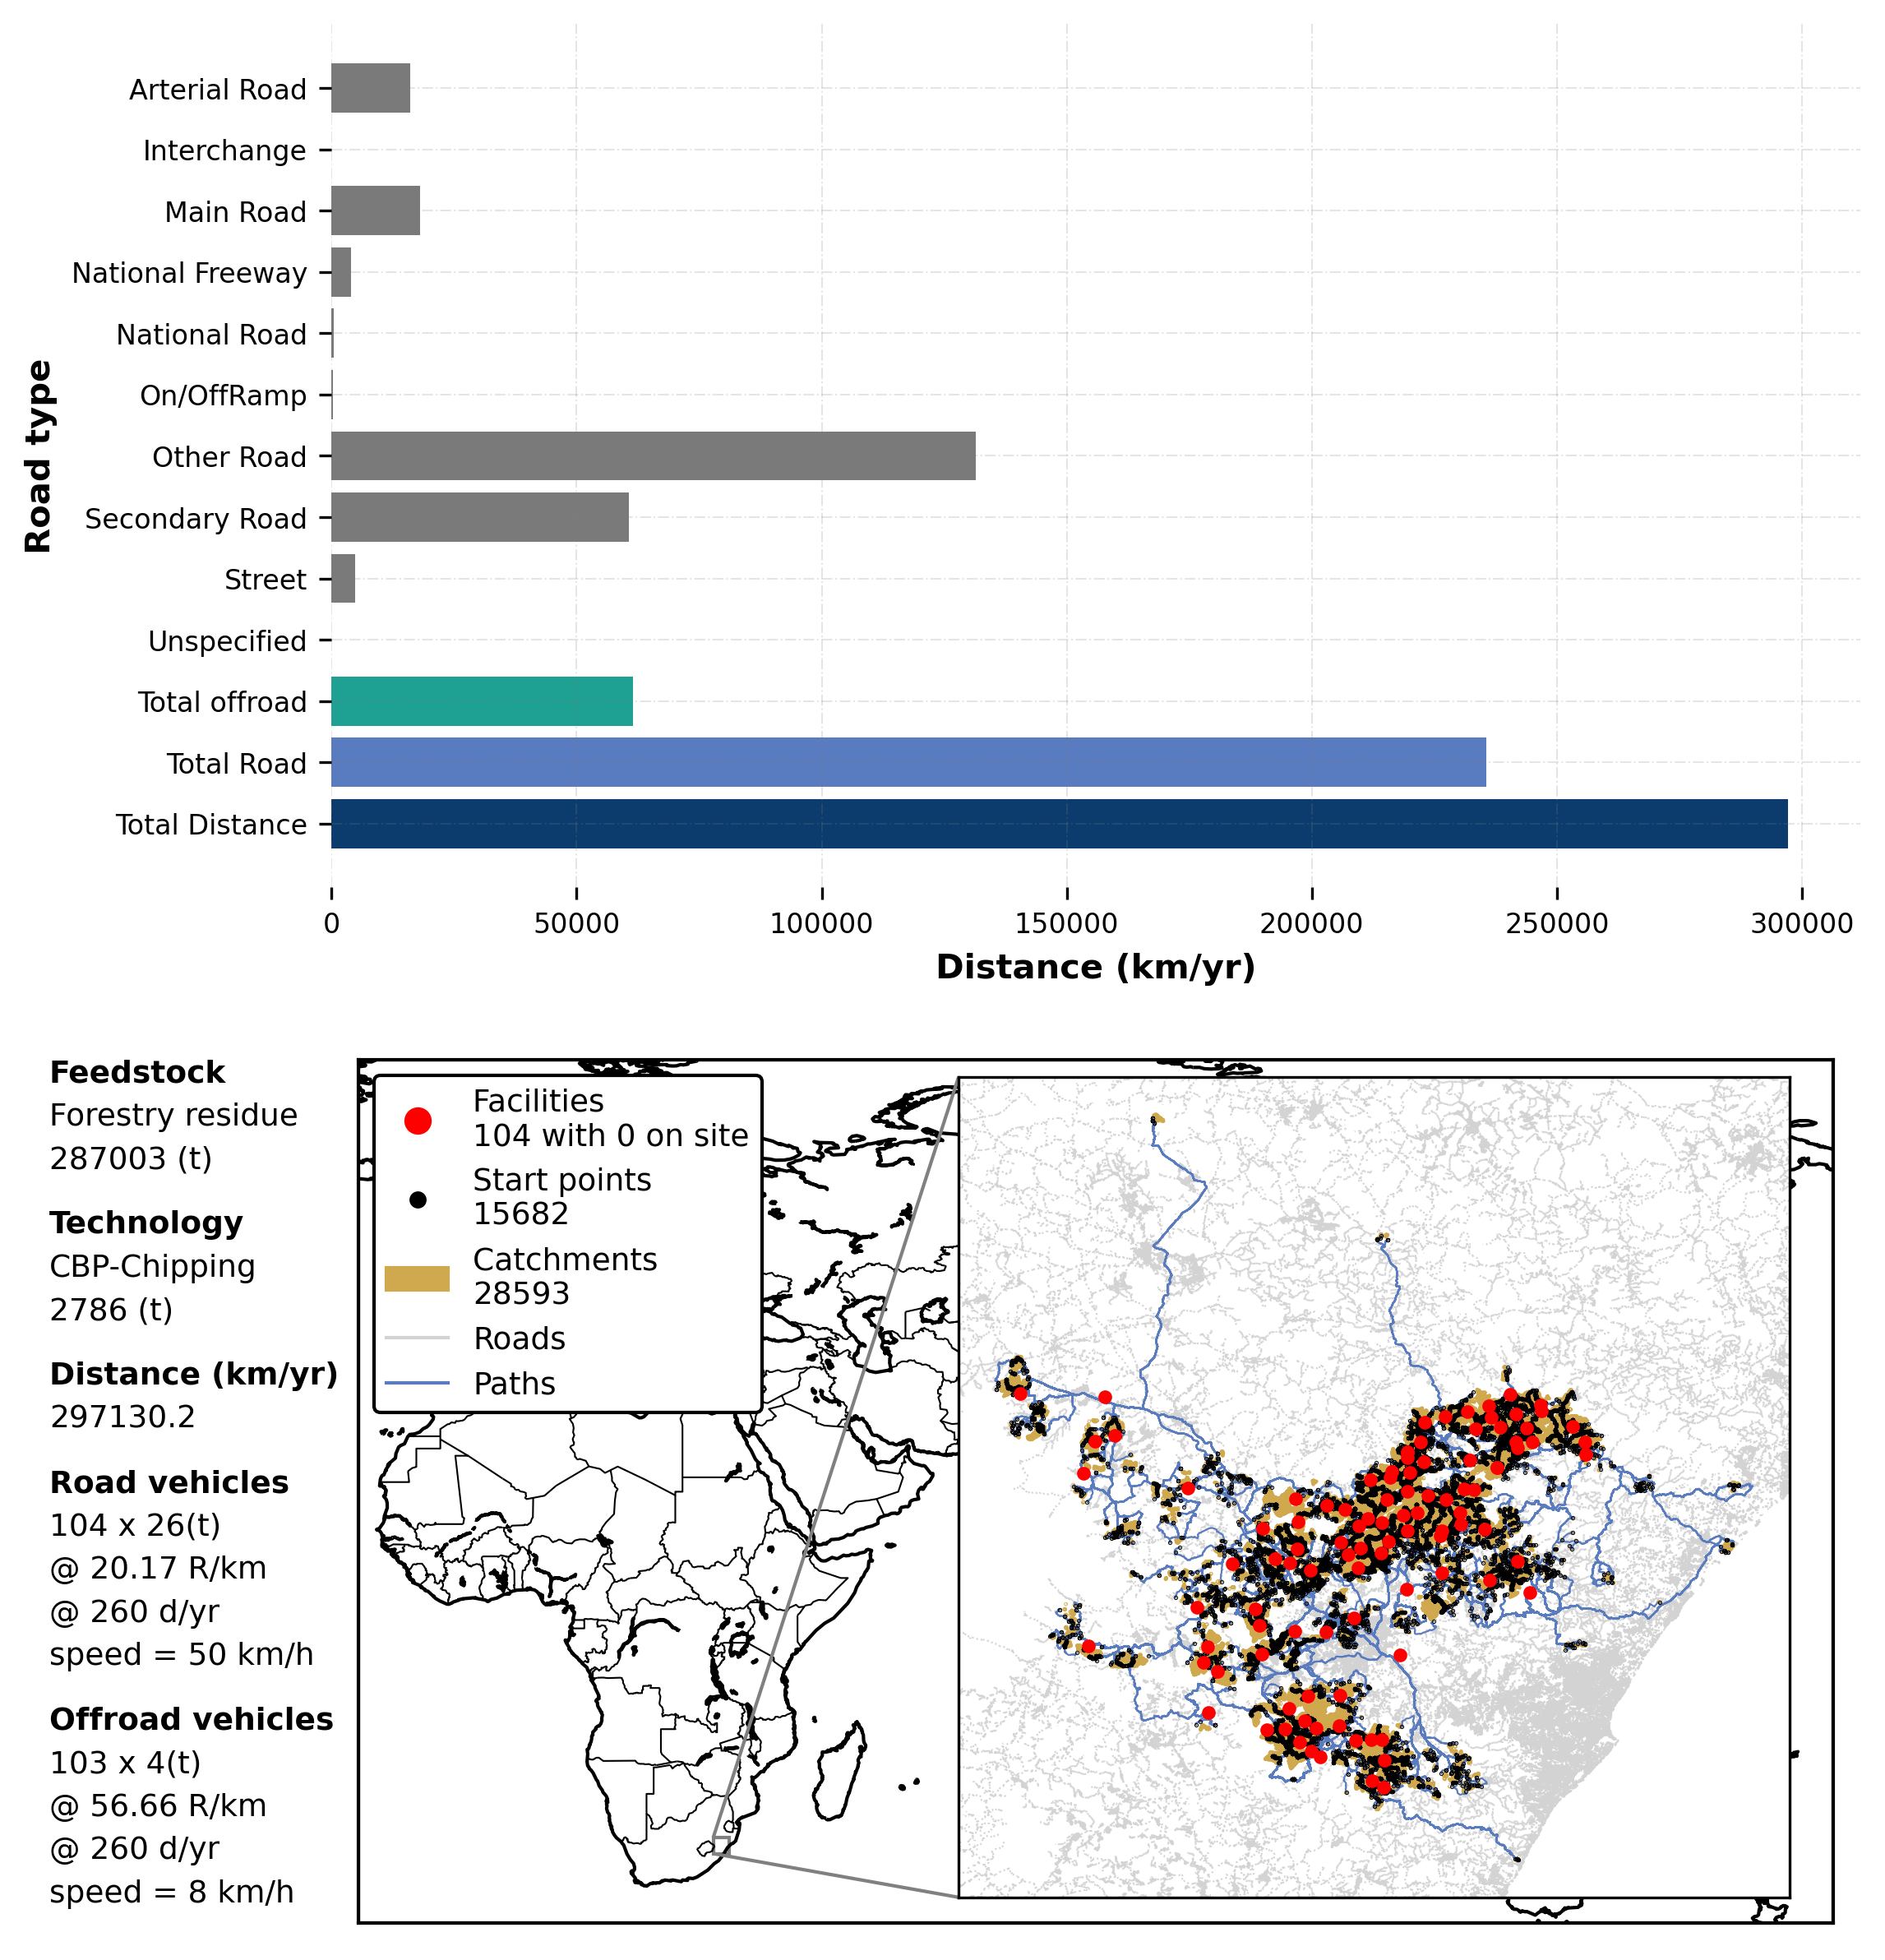
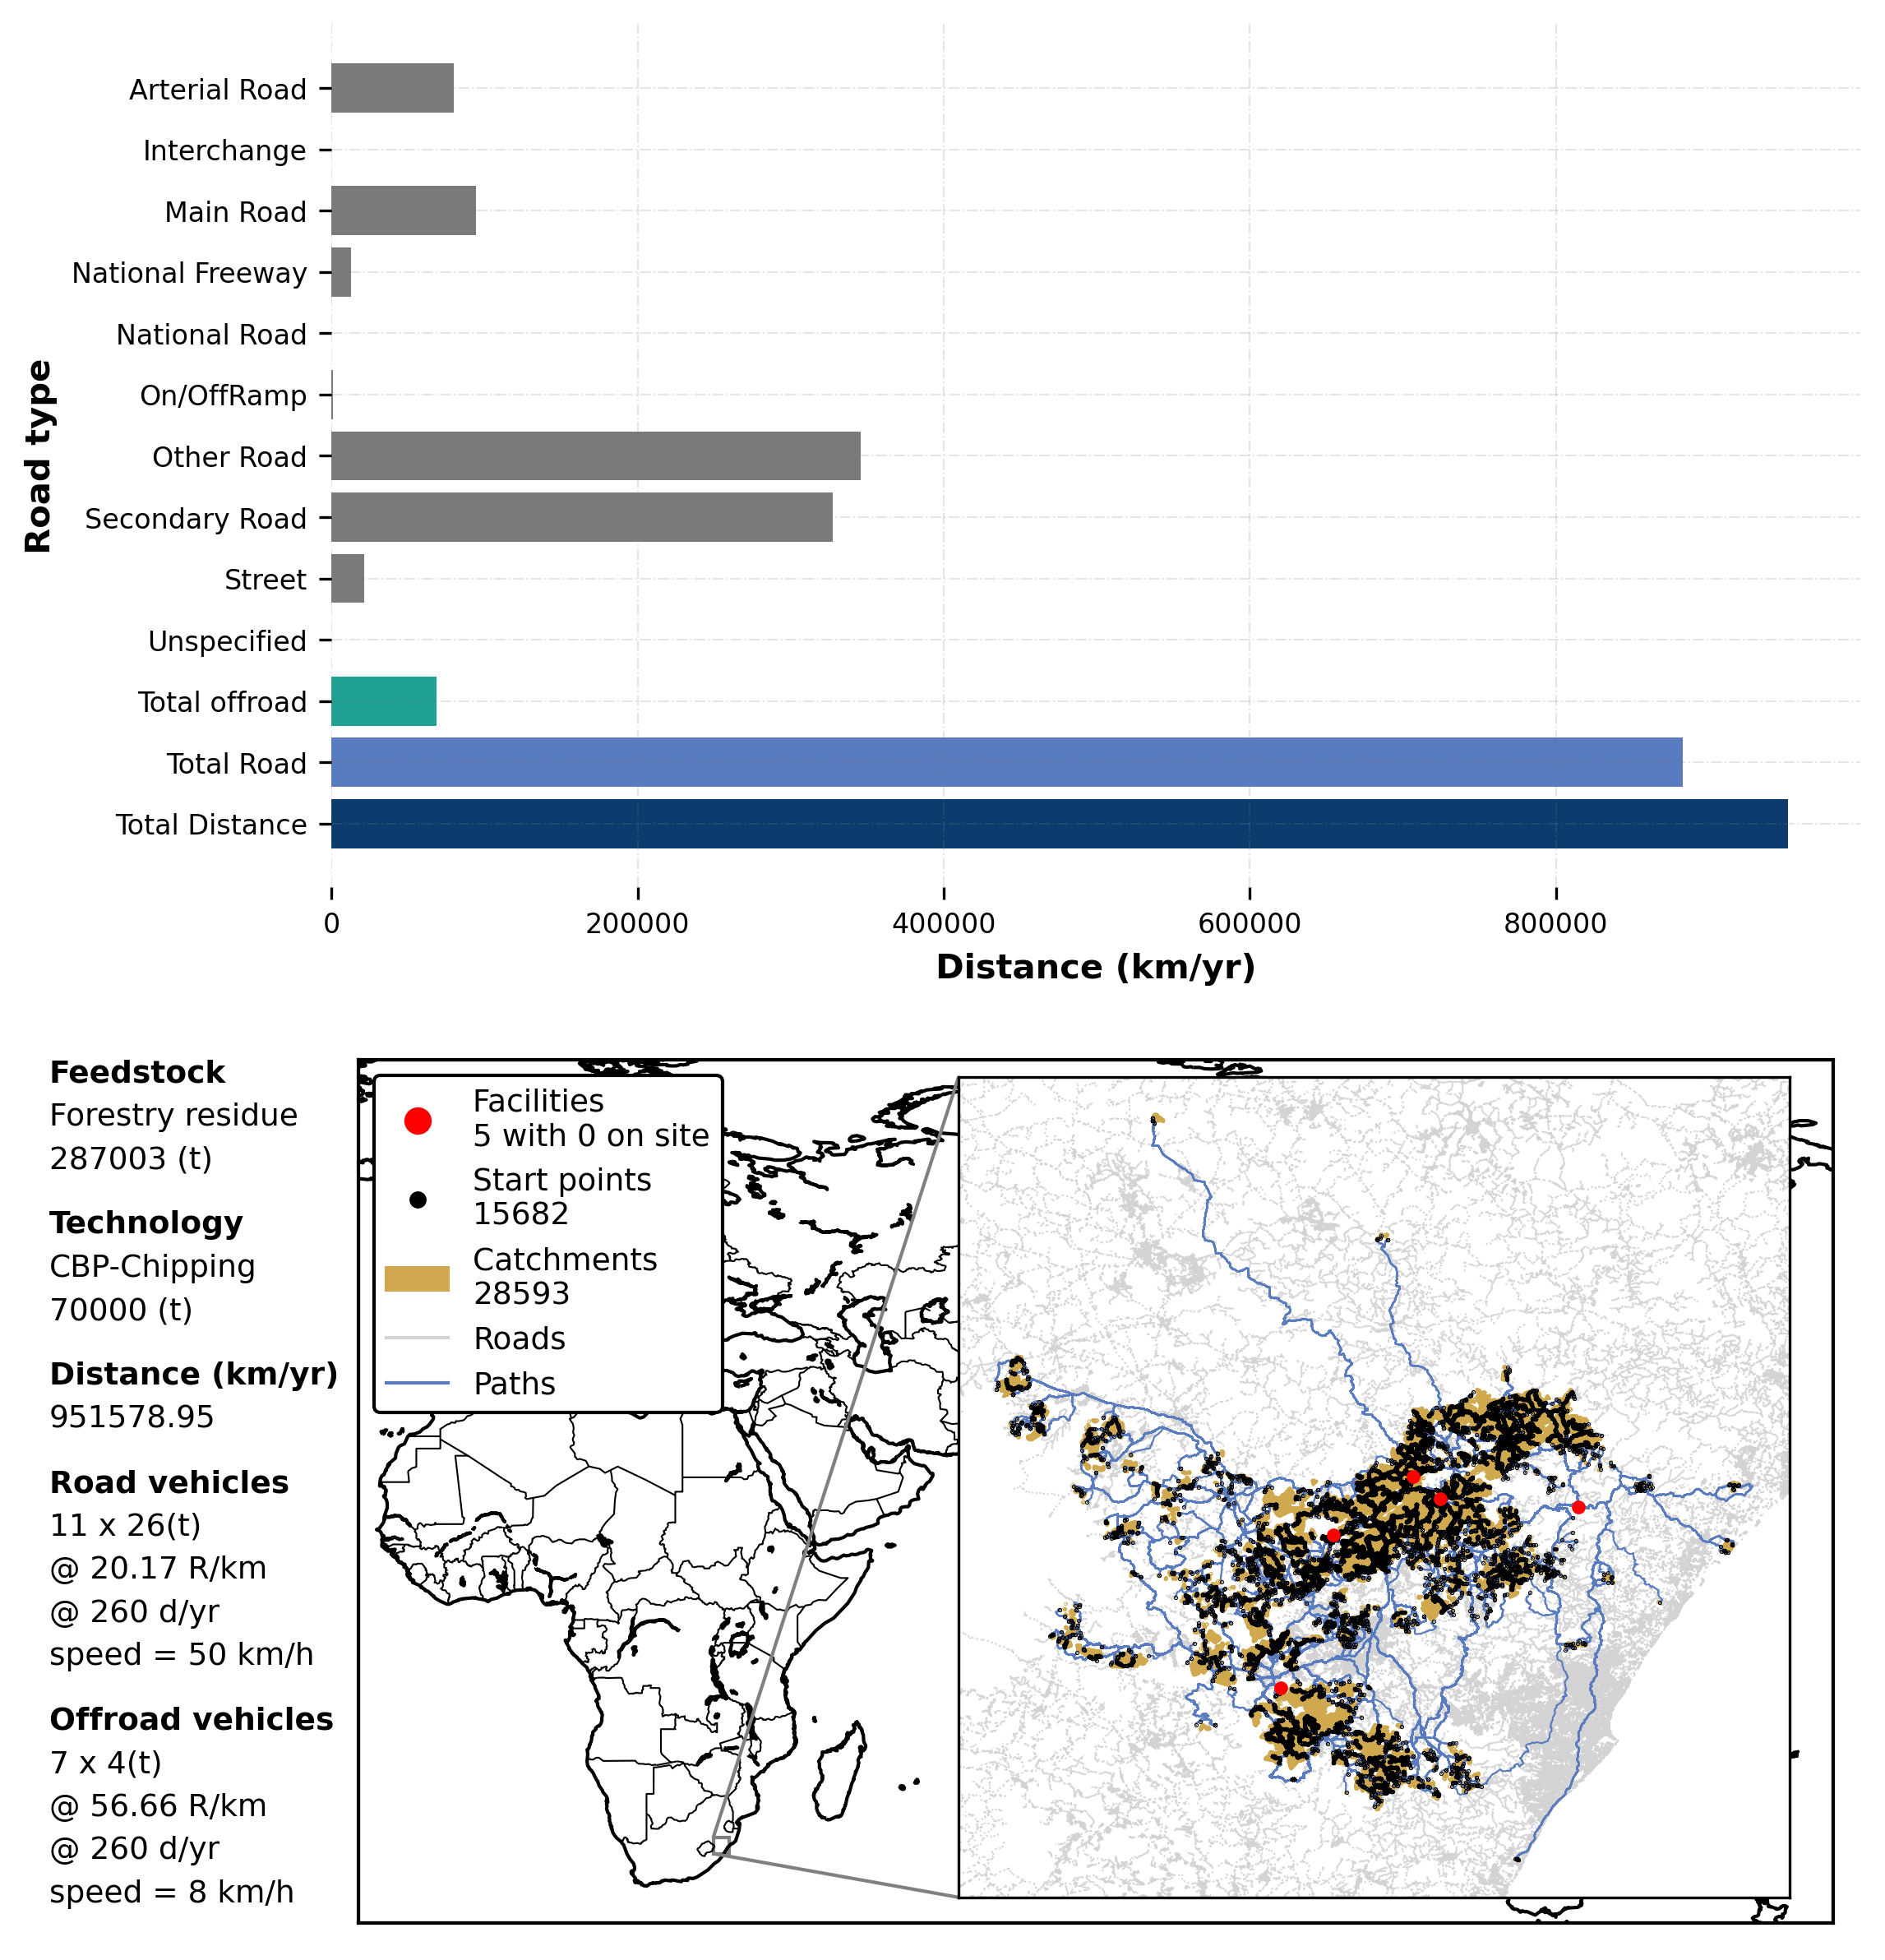
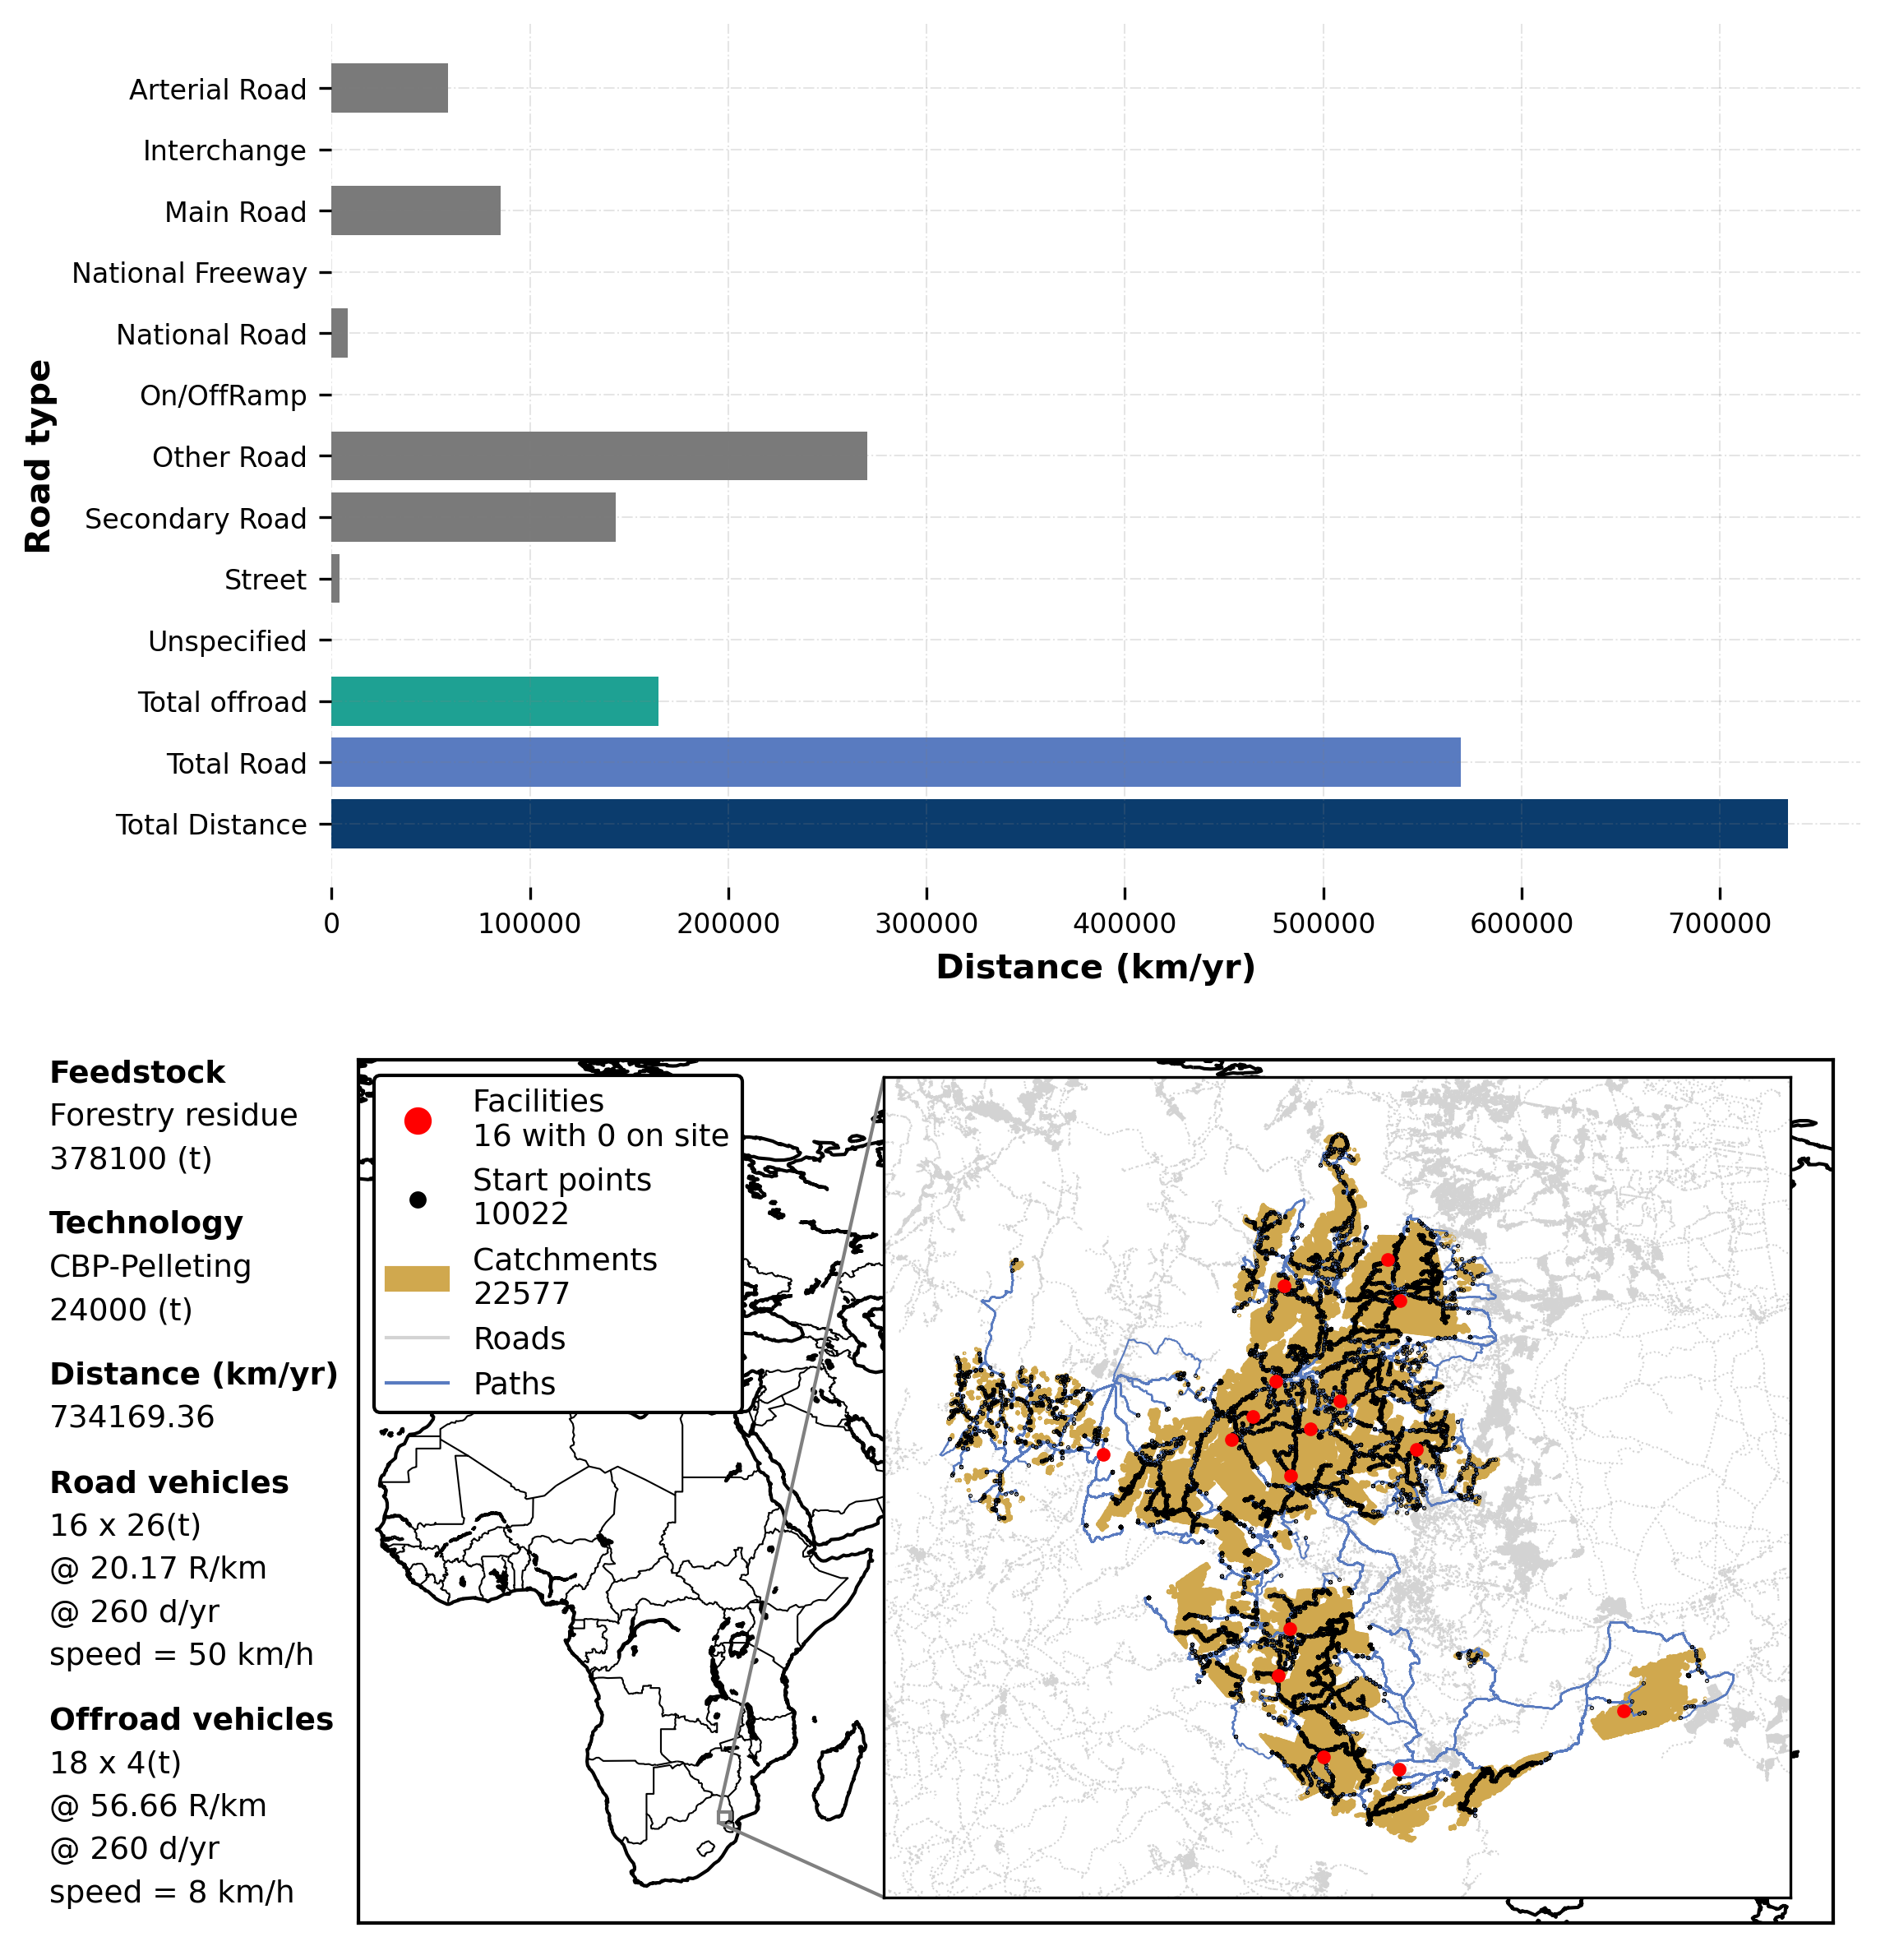
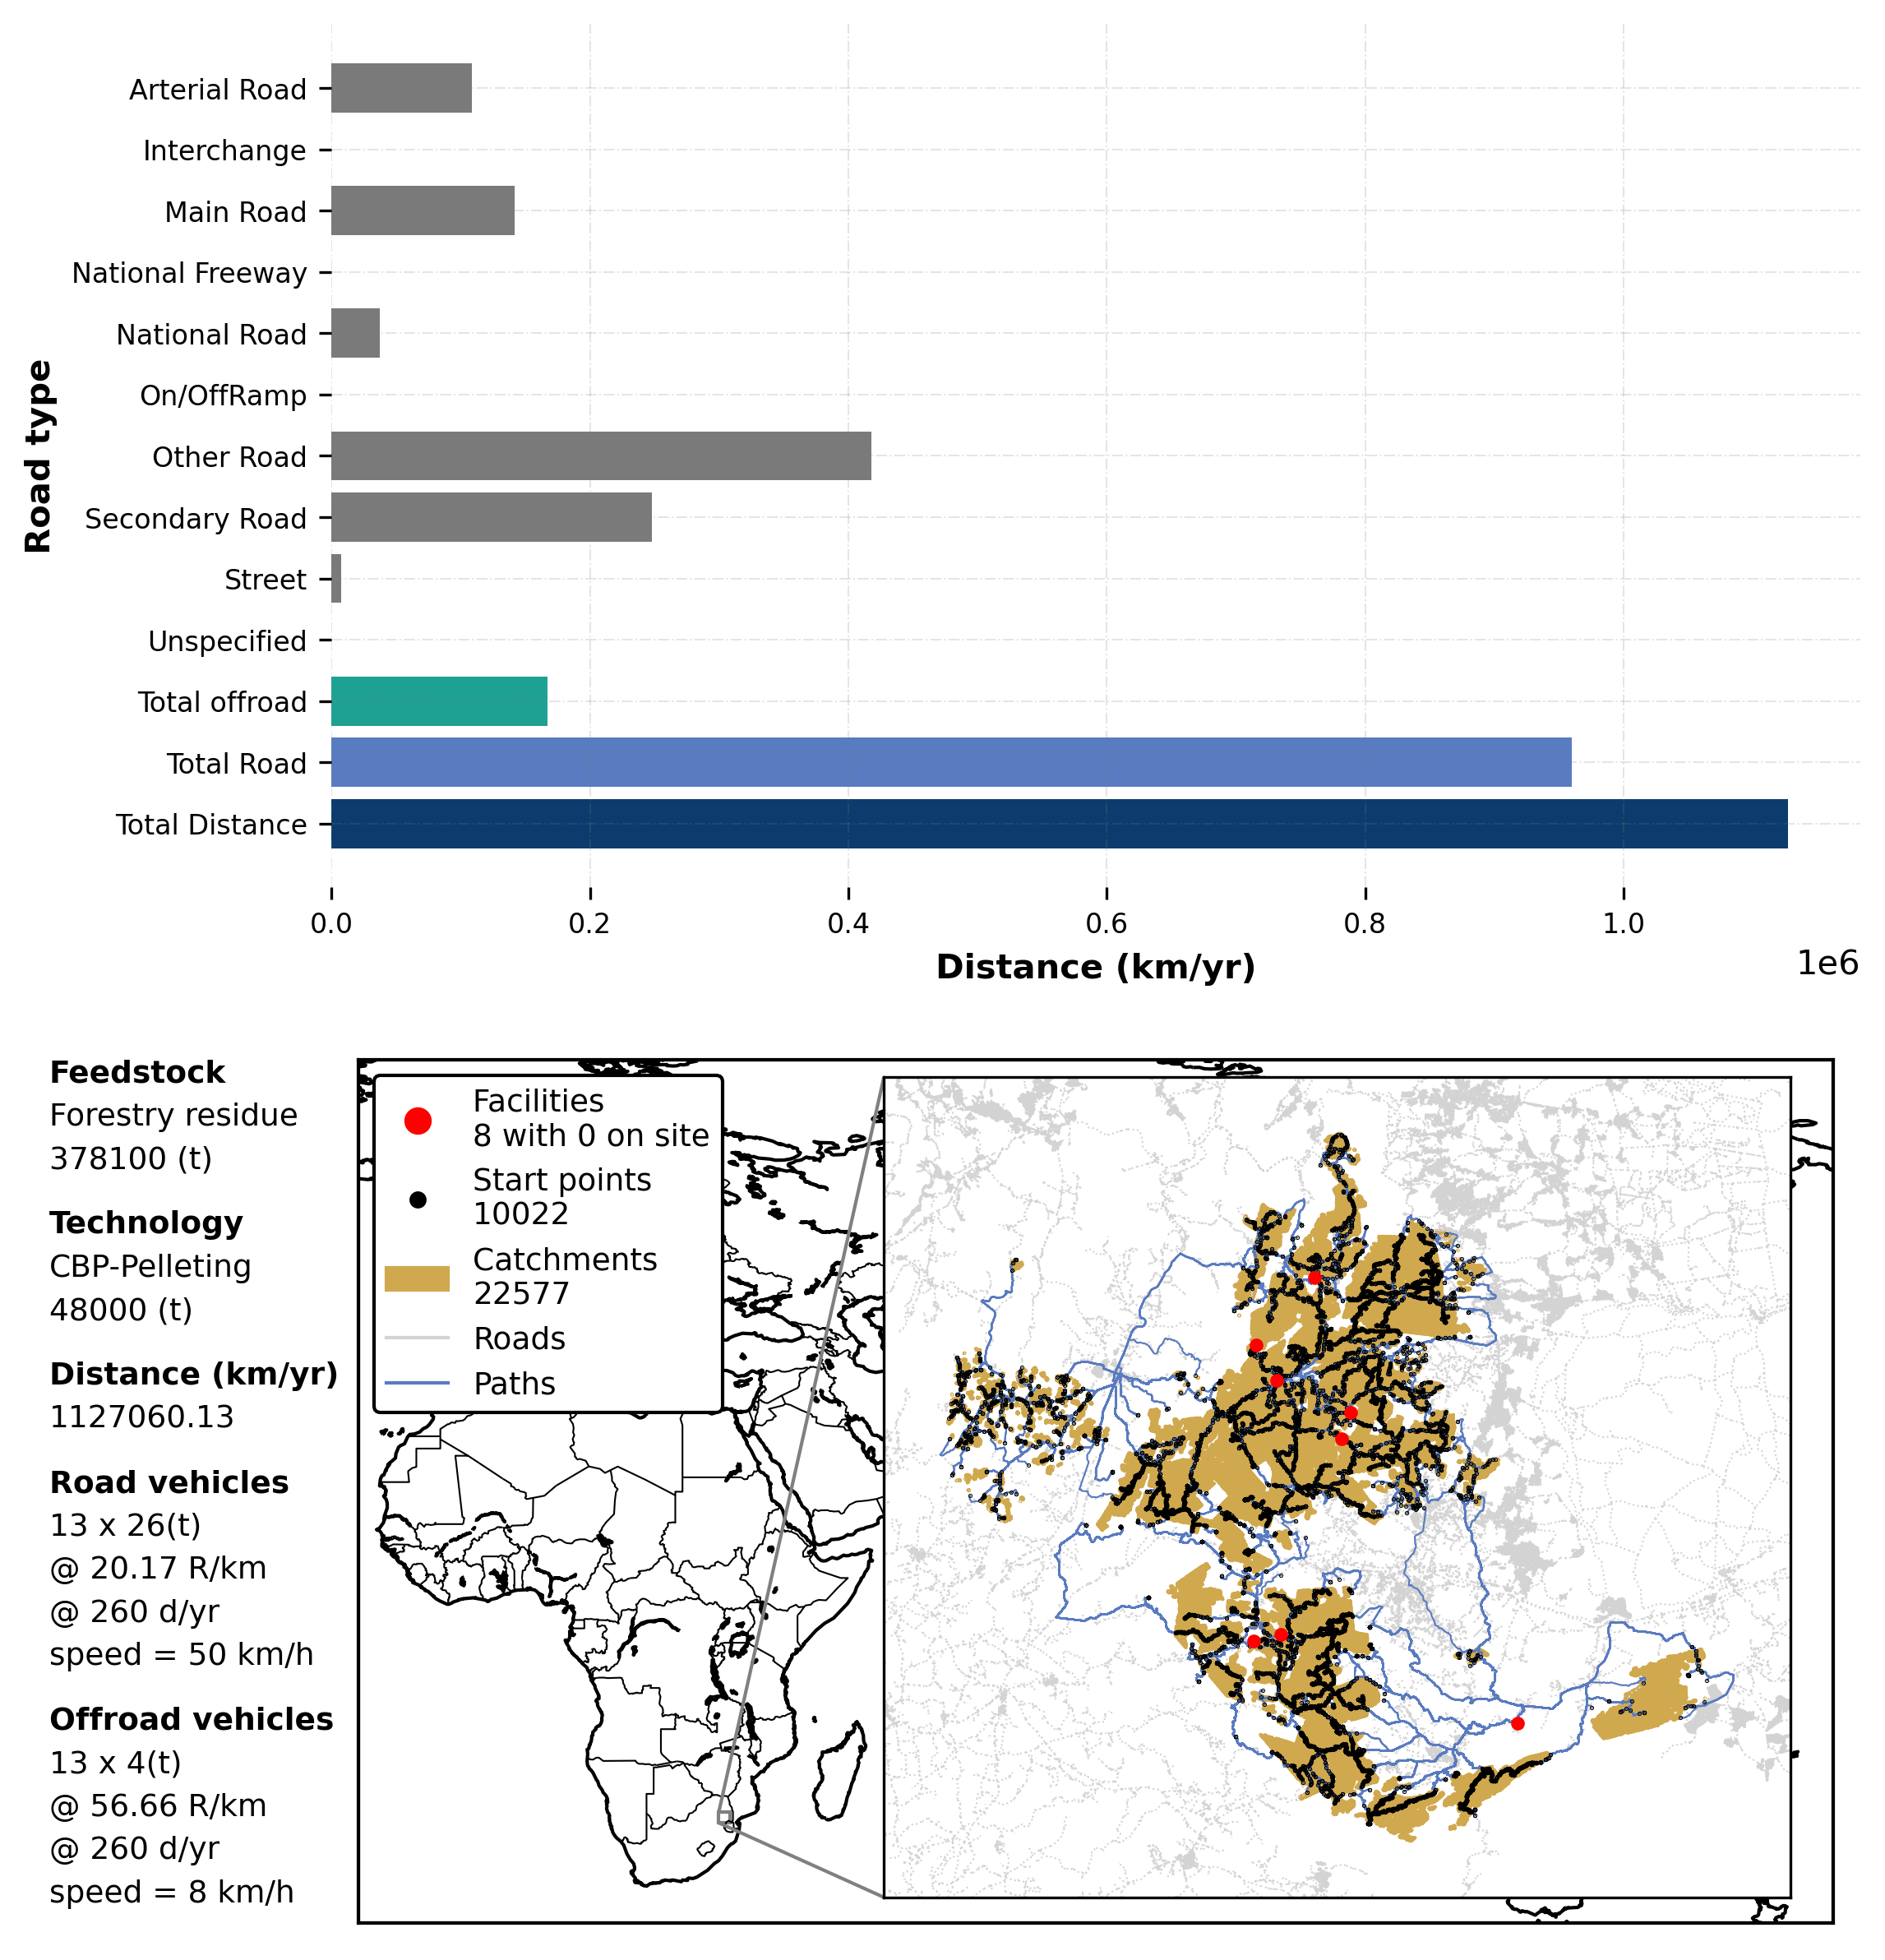
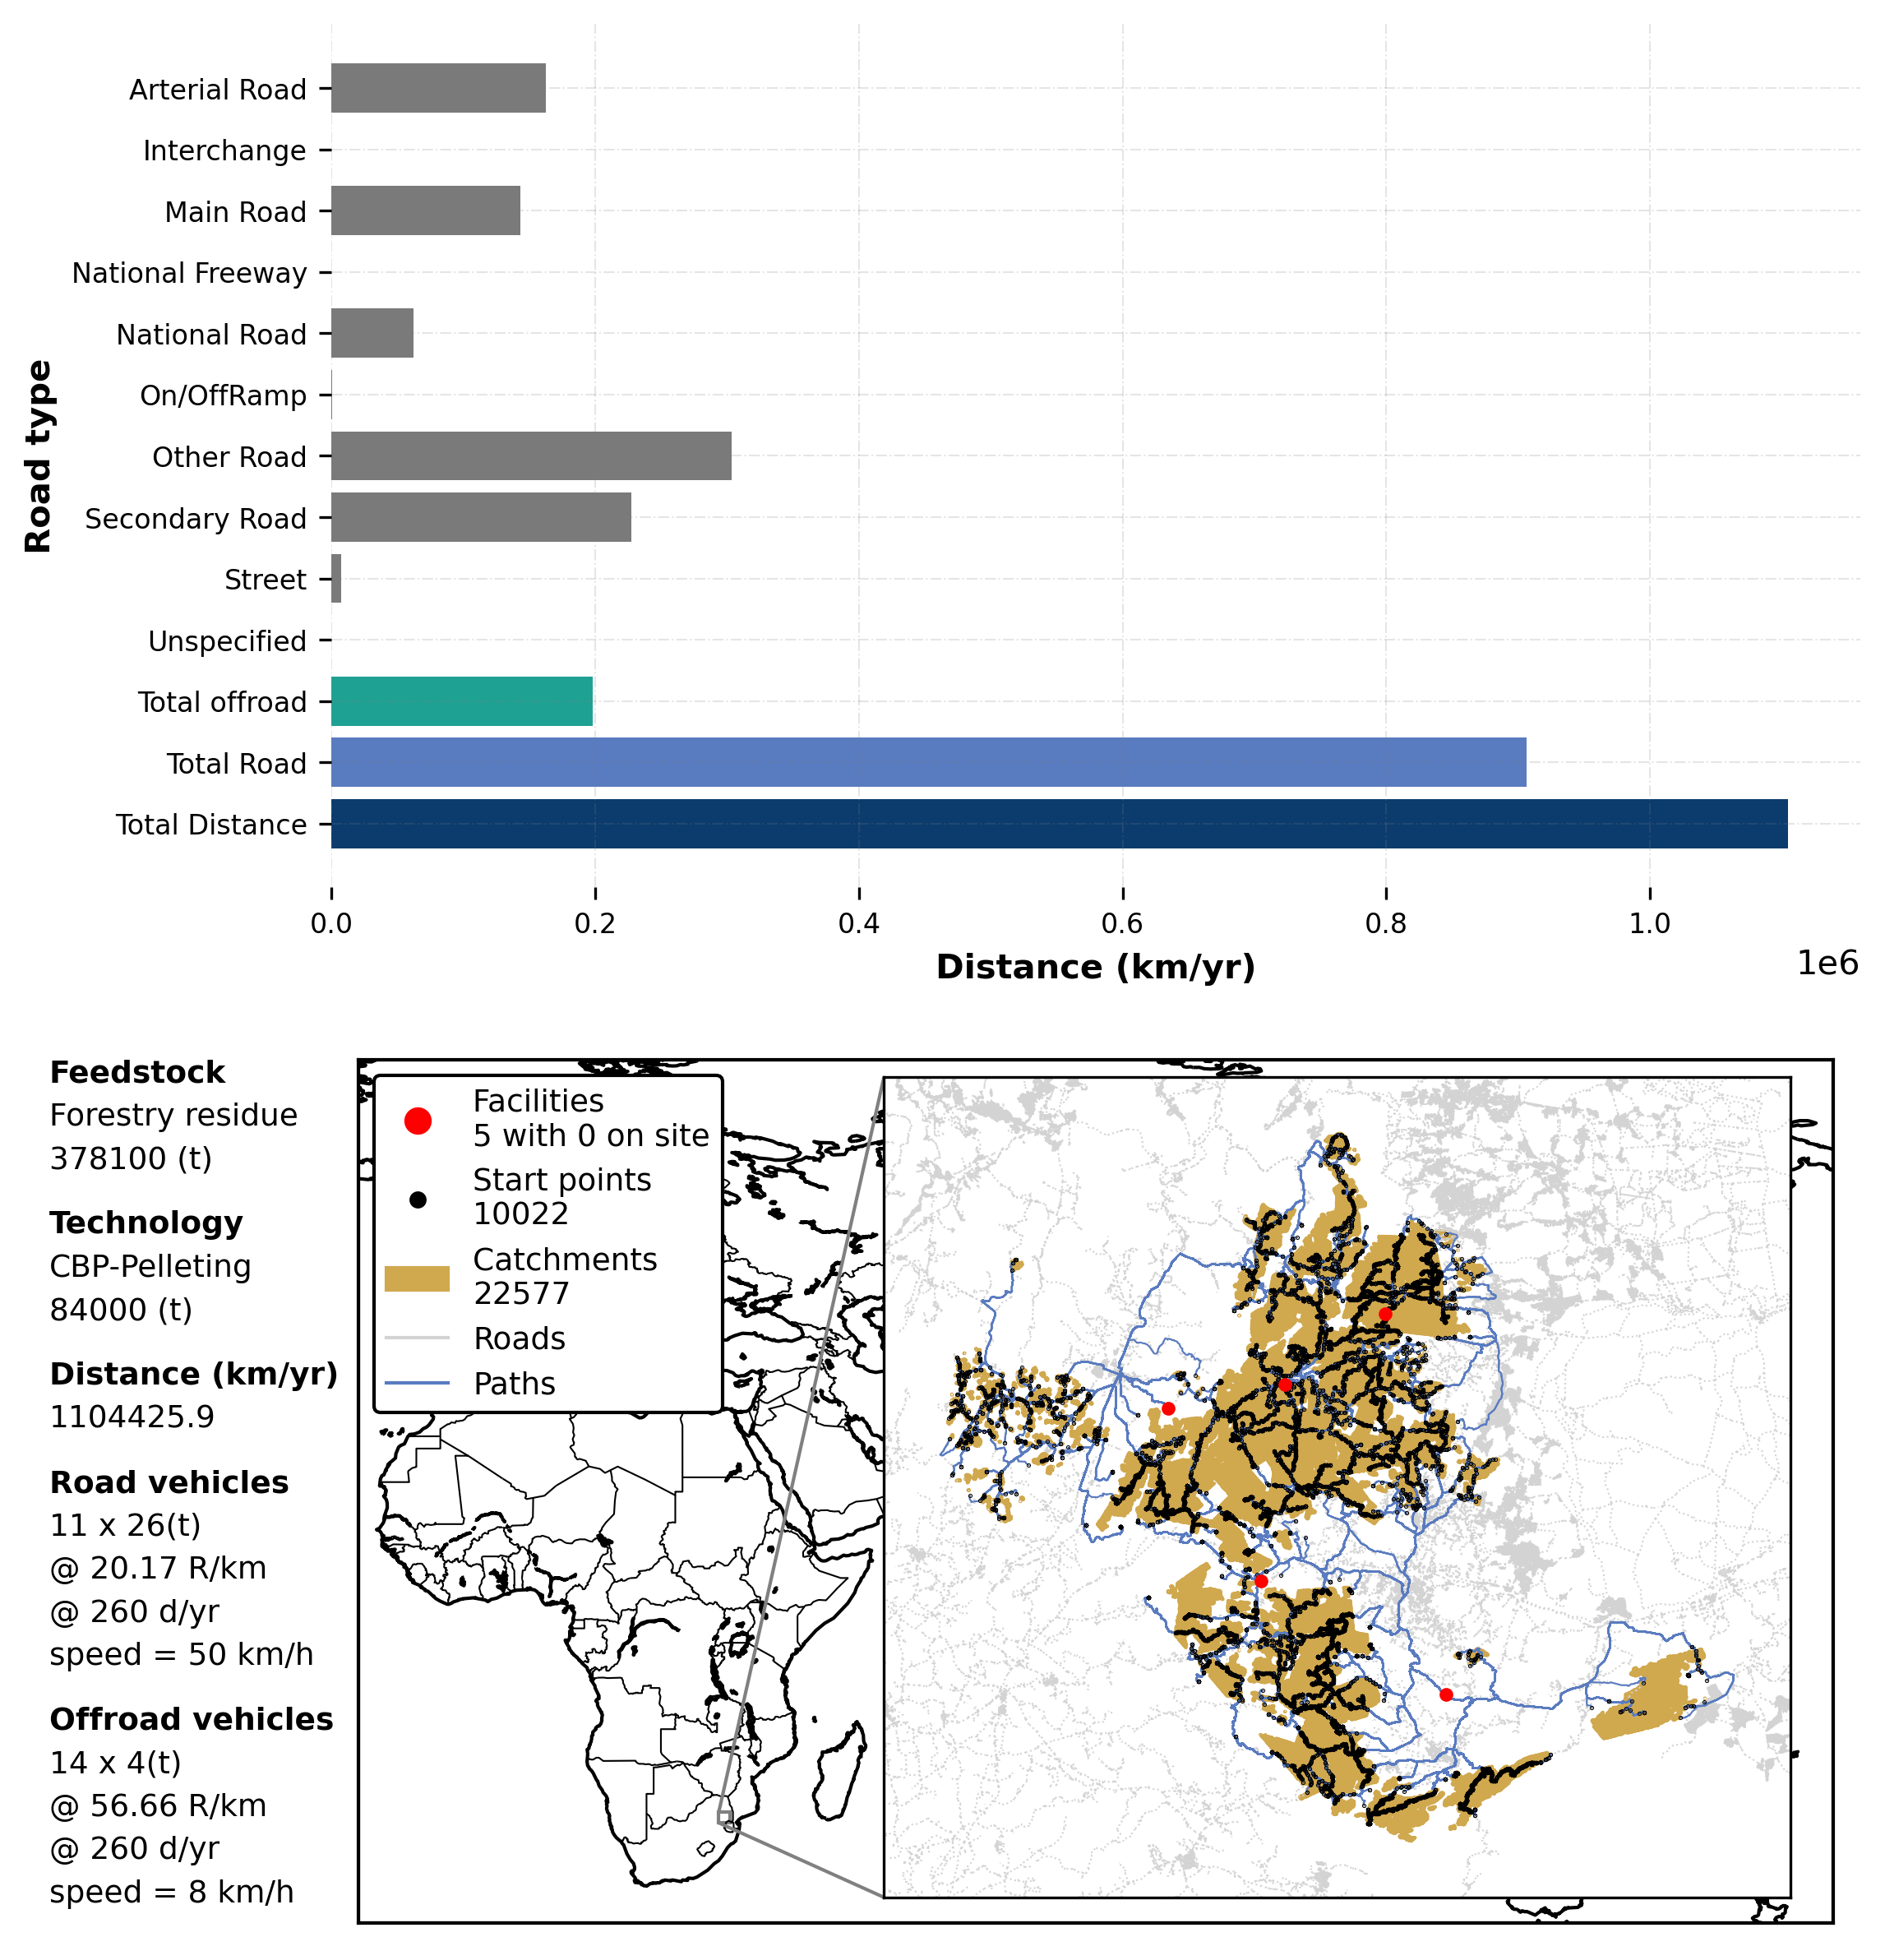
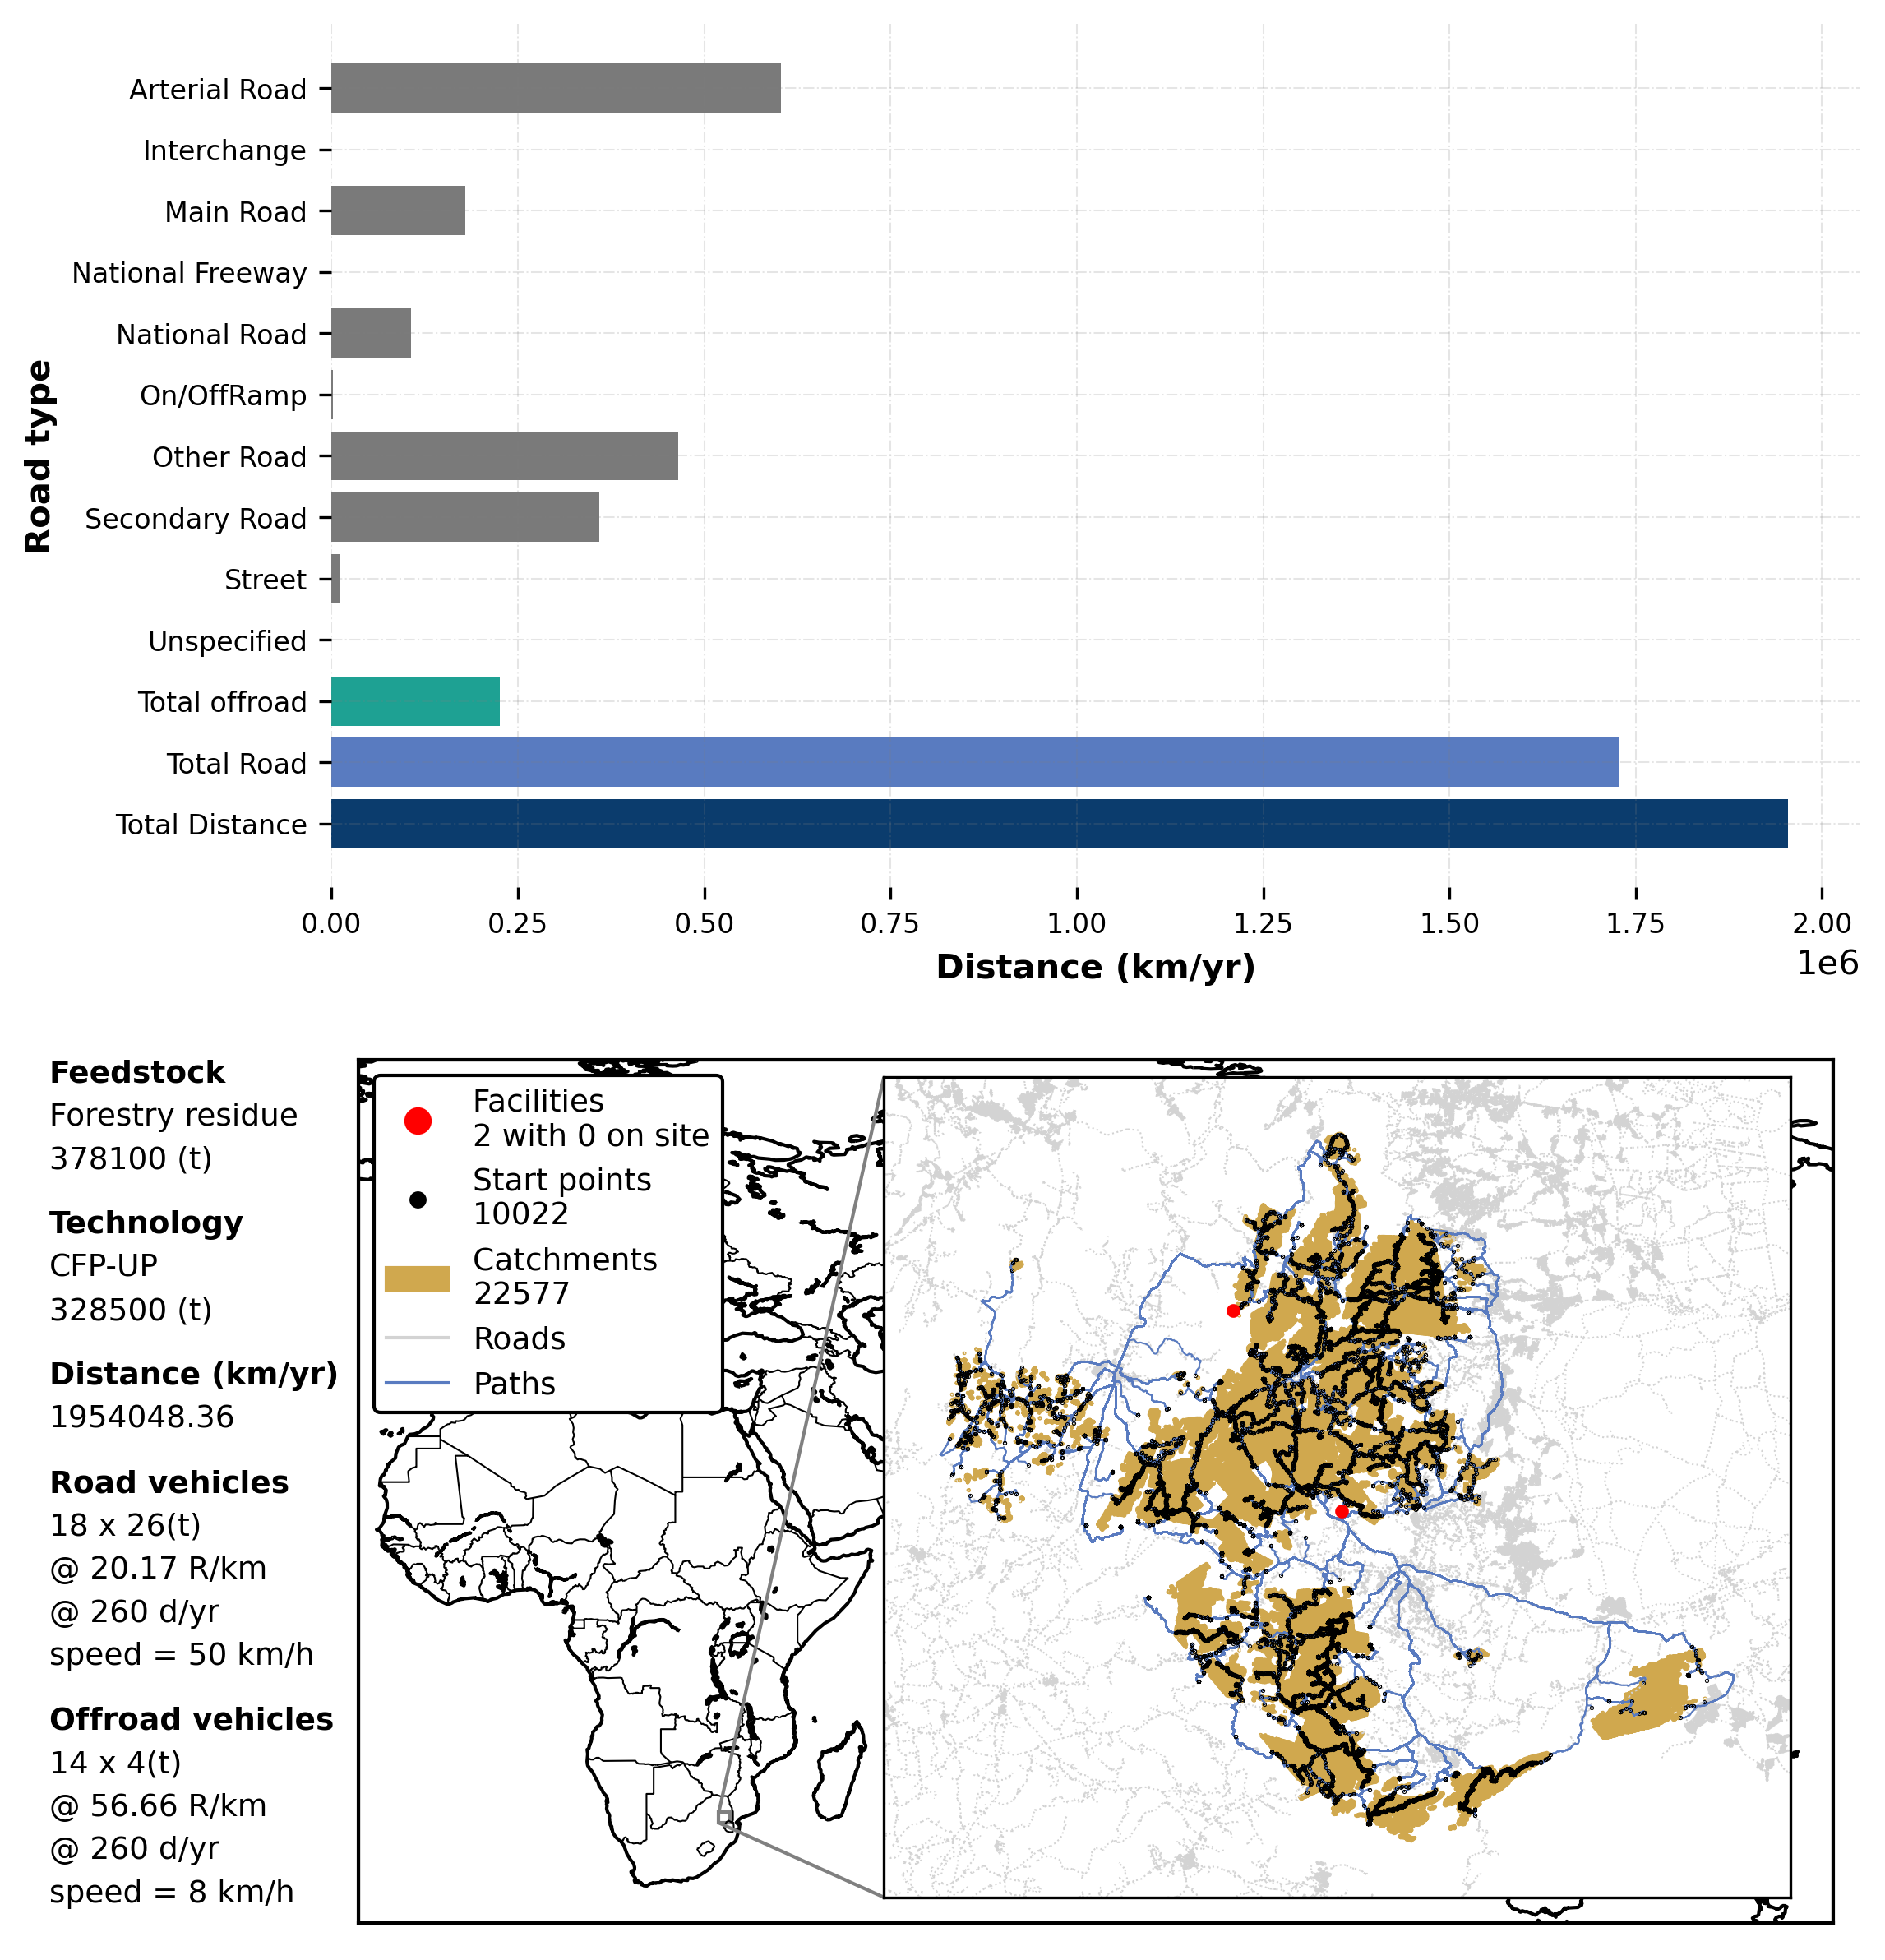
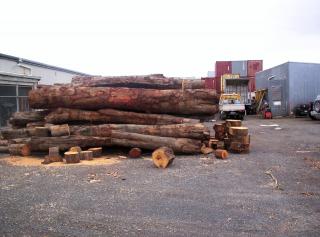
Forestry residue consists of the by-products generated during forestry activities such as harvesting. Typically these include tree limbs, tops and bark which typically remain within the harvested forestry compartment where they form part of the nutrient cycle within that region. However, in certain areas forestry residue presents a significant fire hazard and consequently is removed from site. In these instances, it is possible for the lignocellulose within the forestry residue to be used as a bioenergy feedstock. 24 million tons of forestry residue biomass is produced in South Africa annually (2019/2020), with three localities (catchment areas) in South Africa being predominant, accounting for over 50% of the available commercial forestry waste.

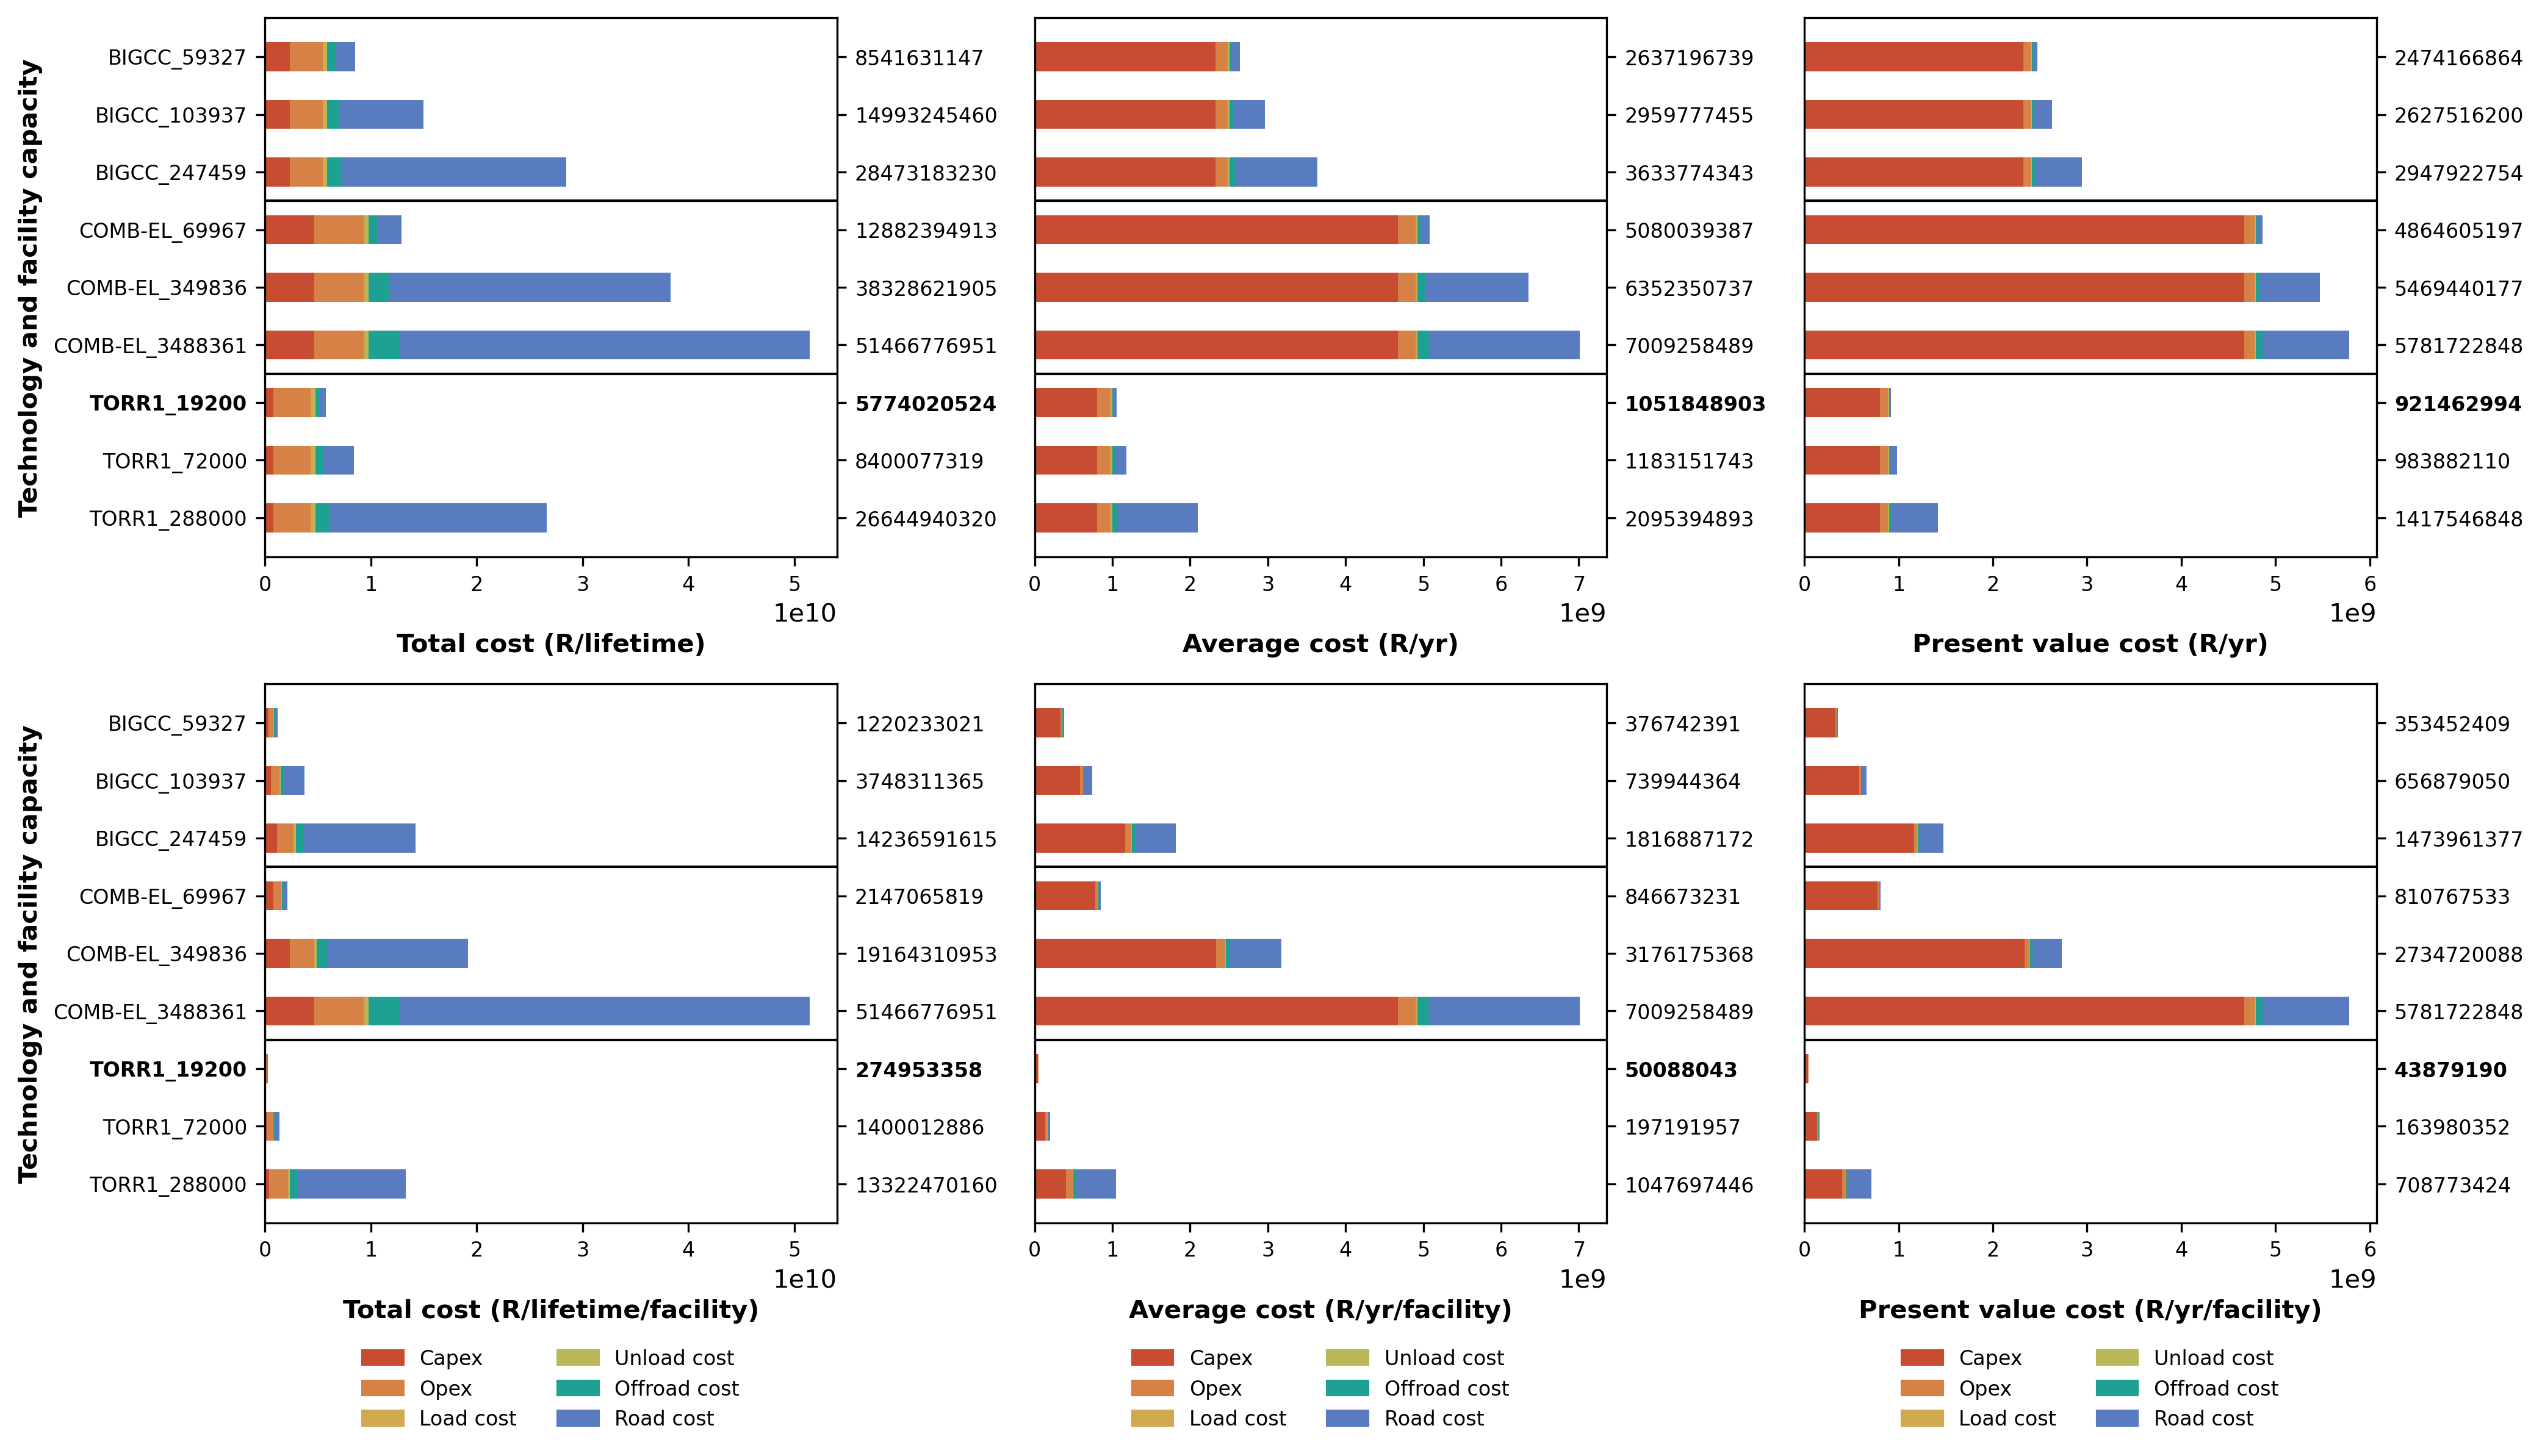
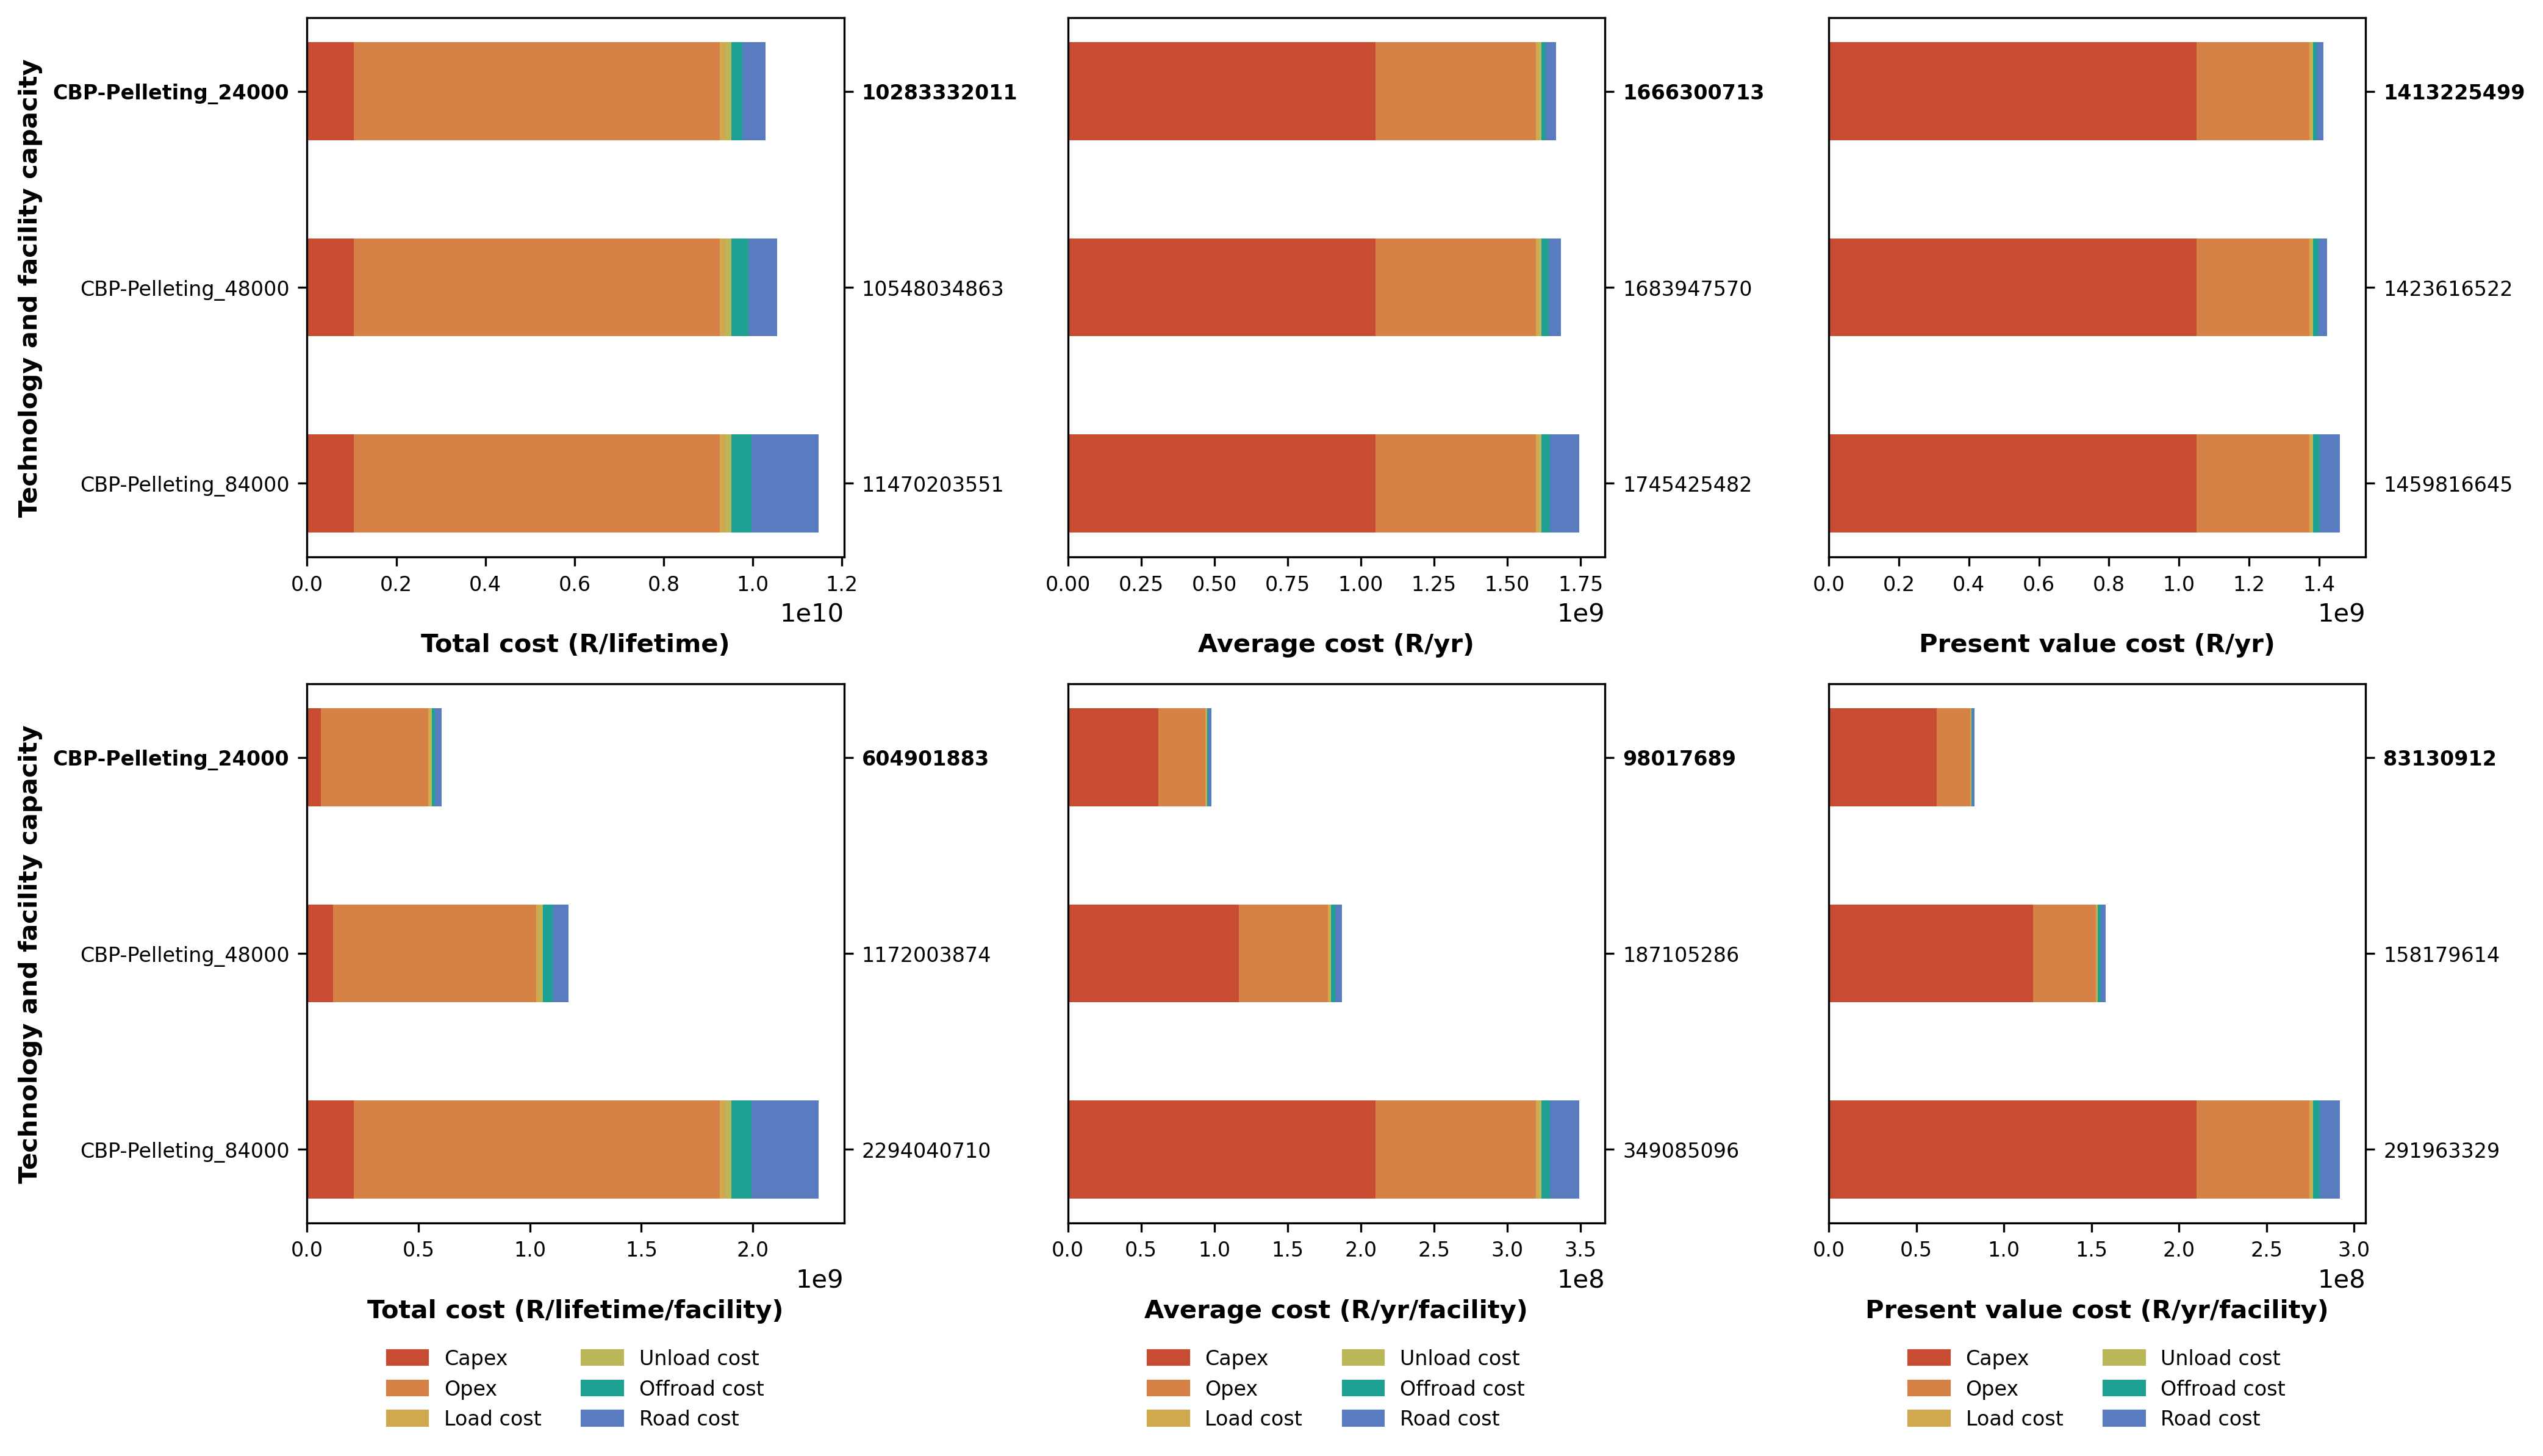
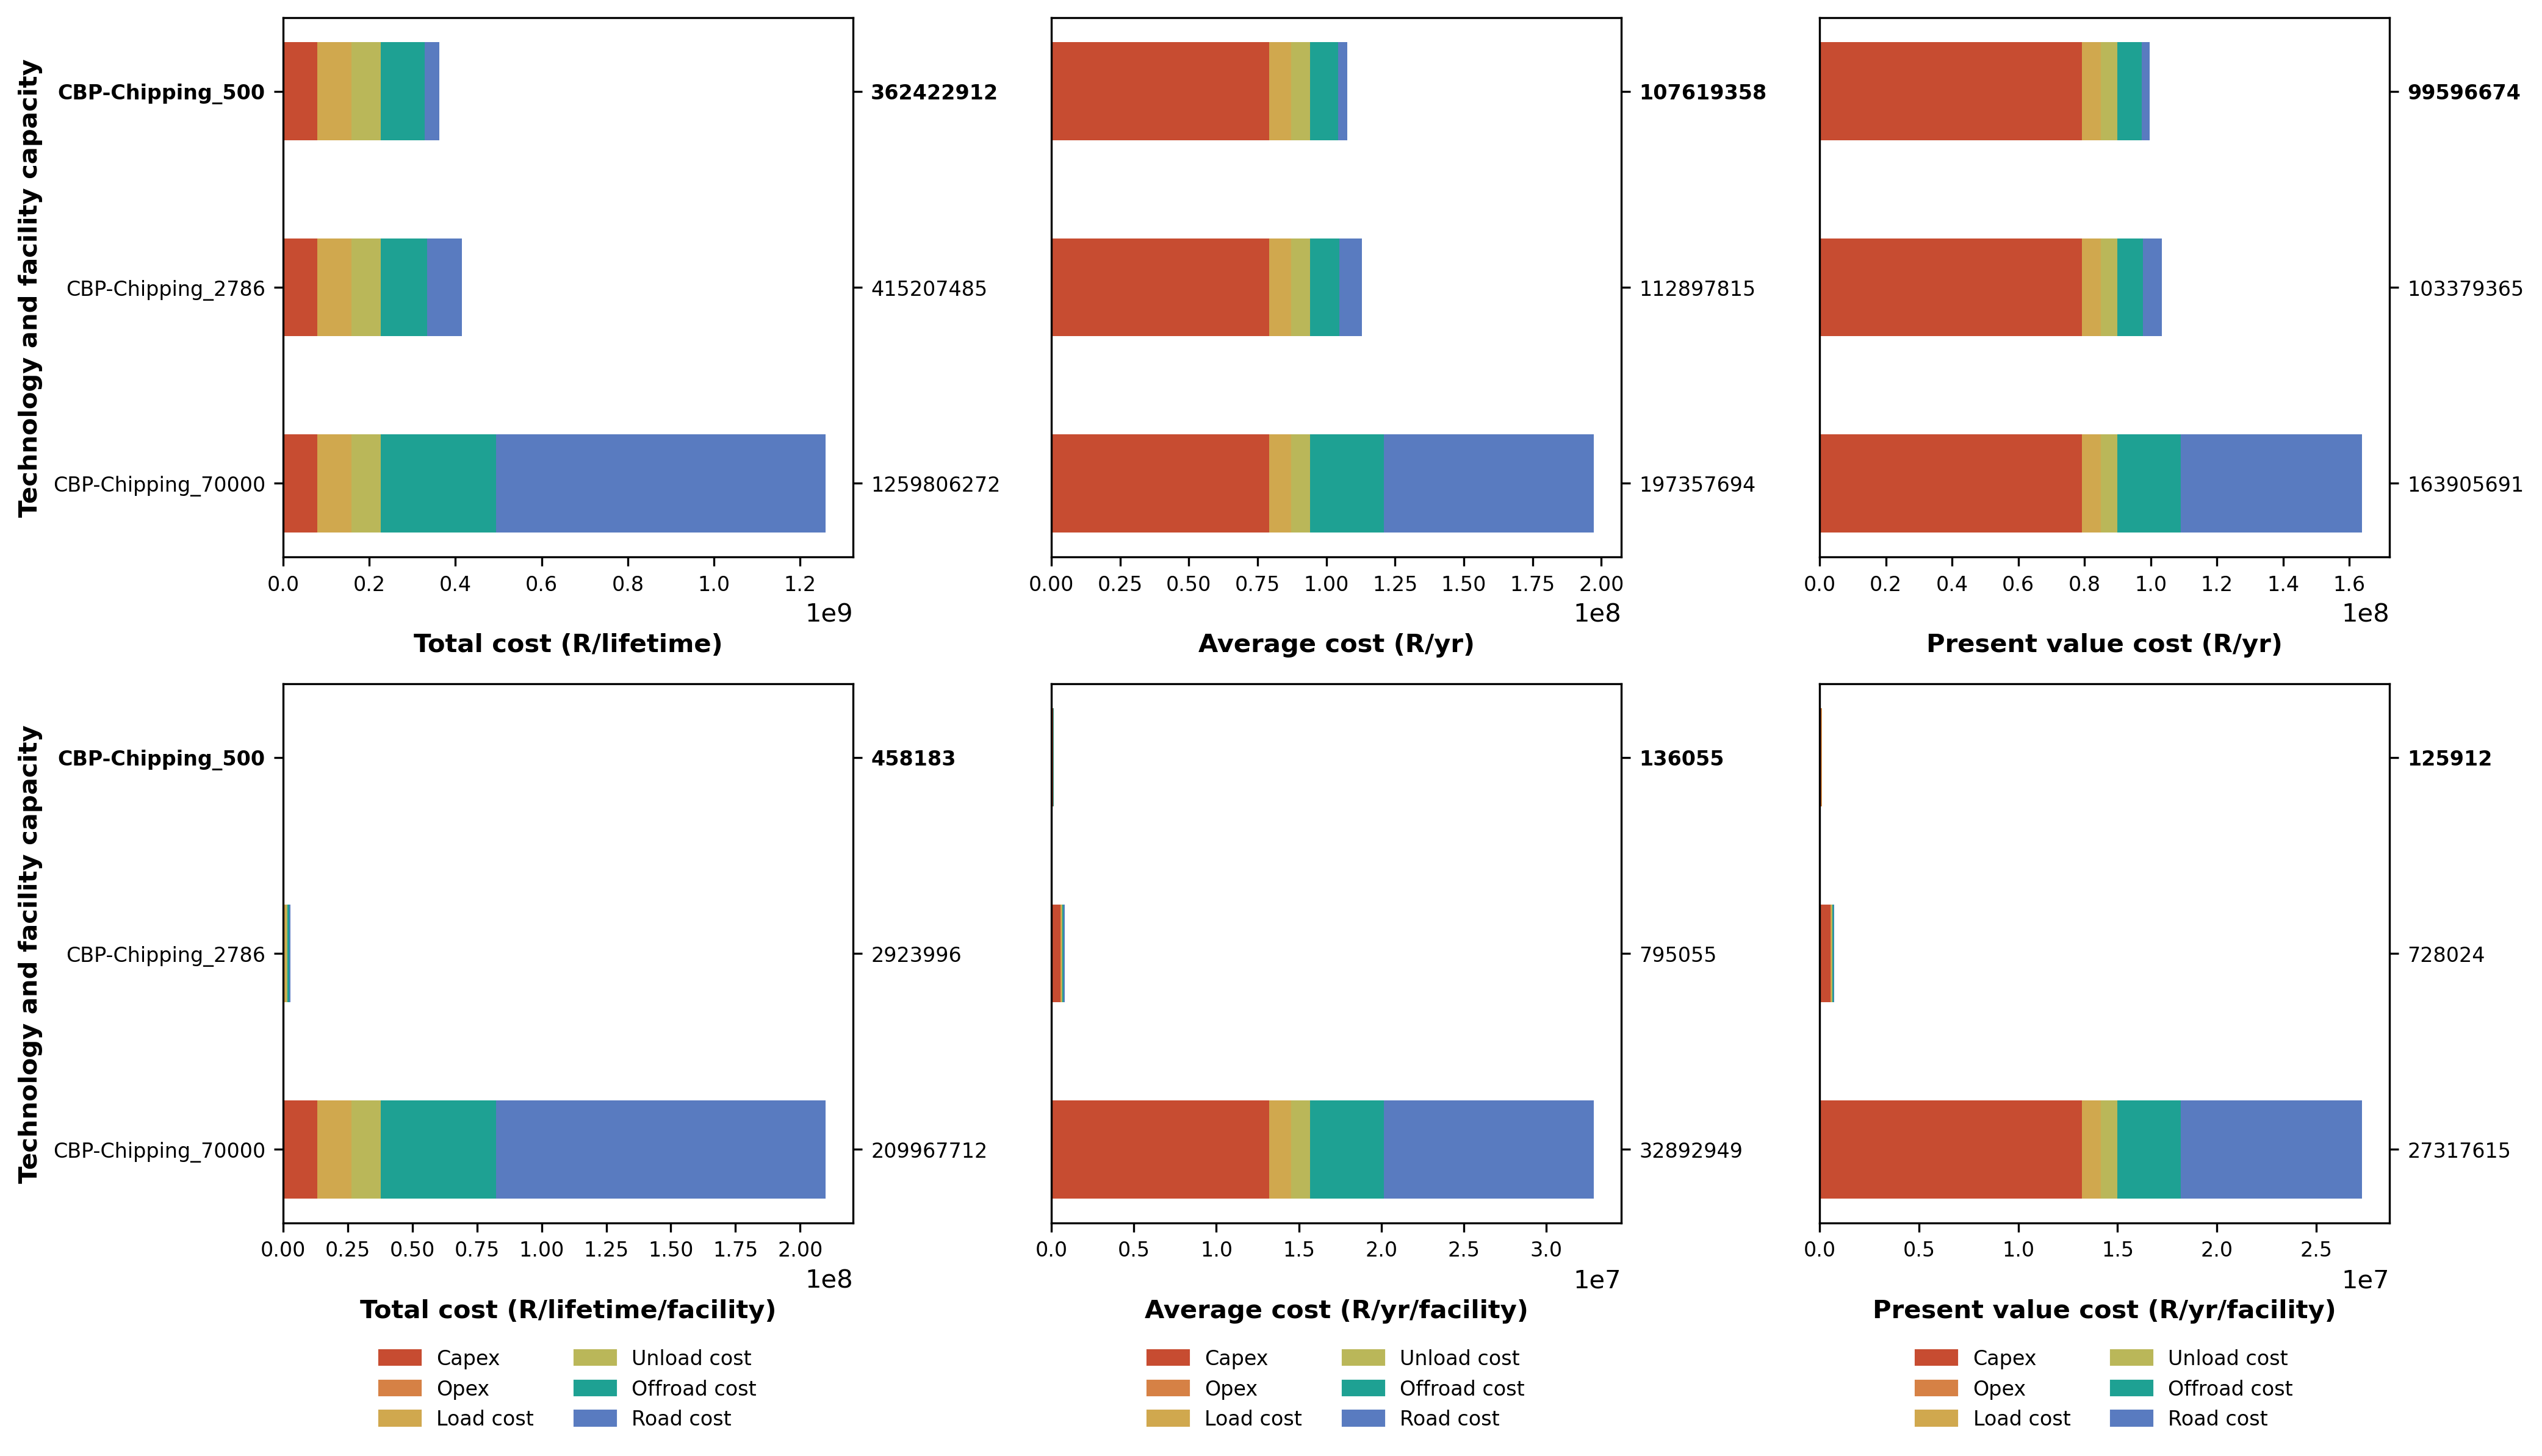
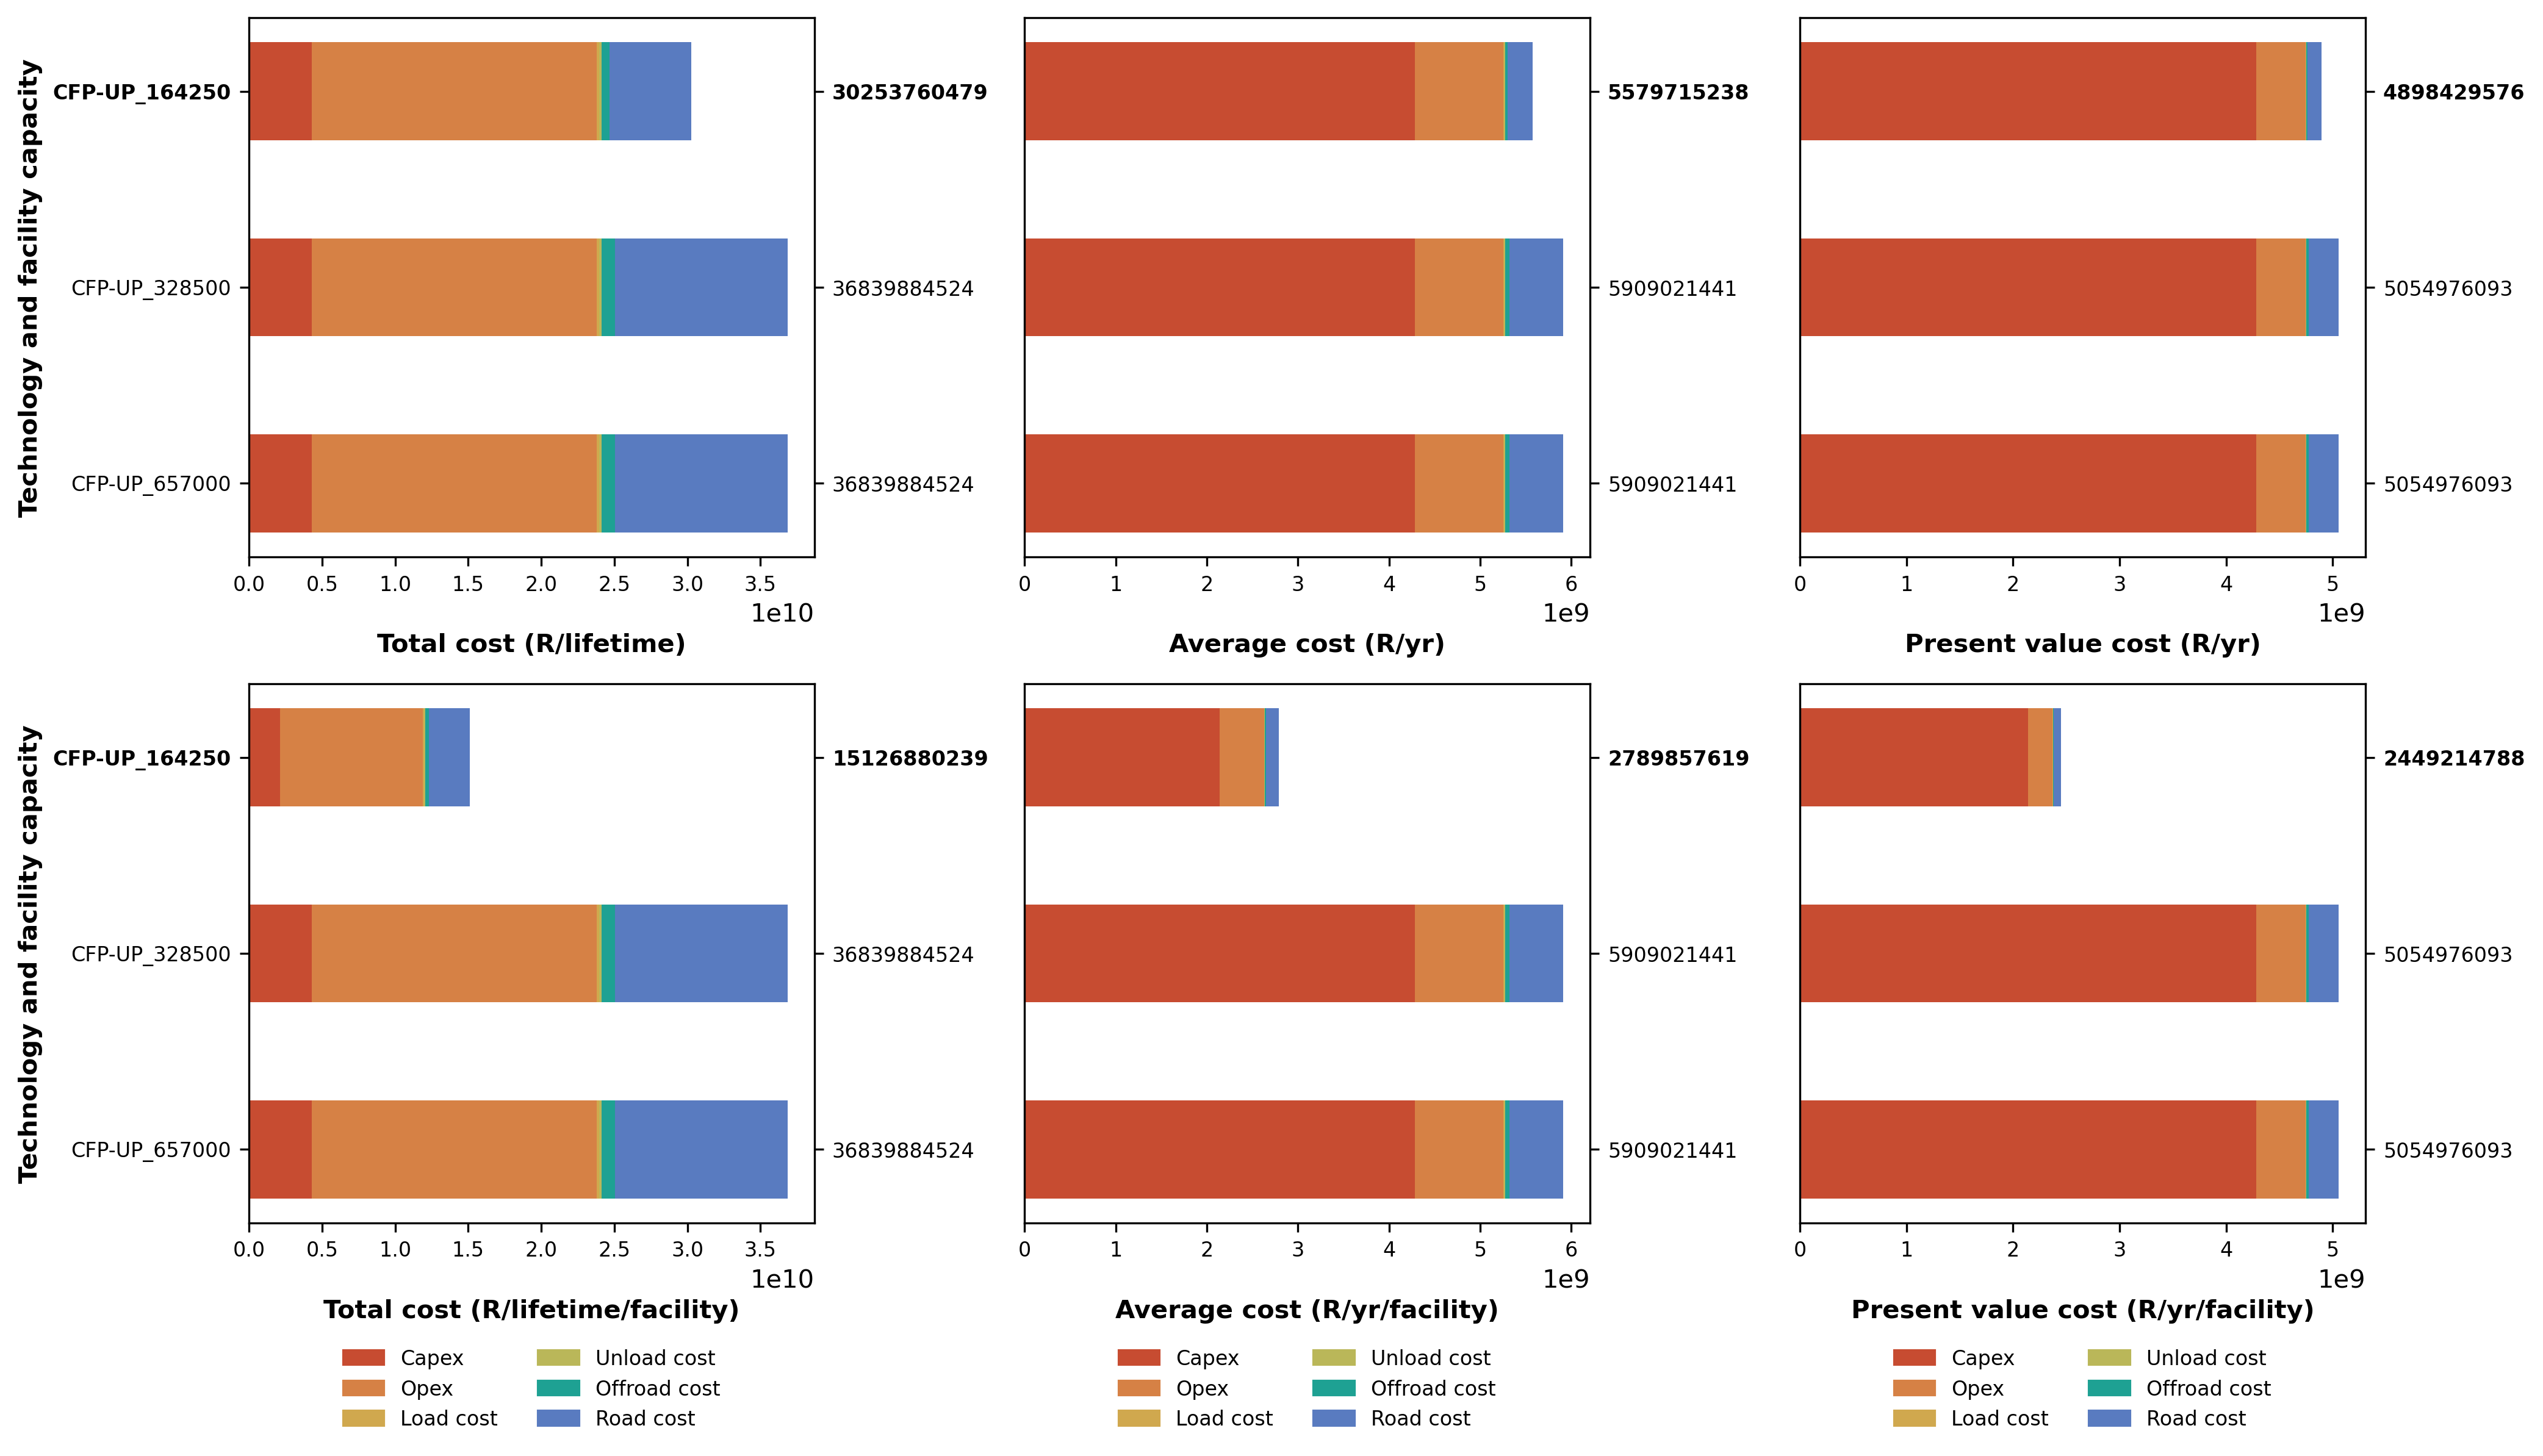
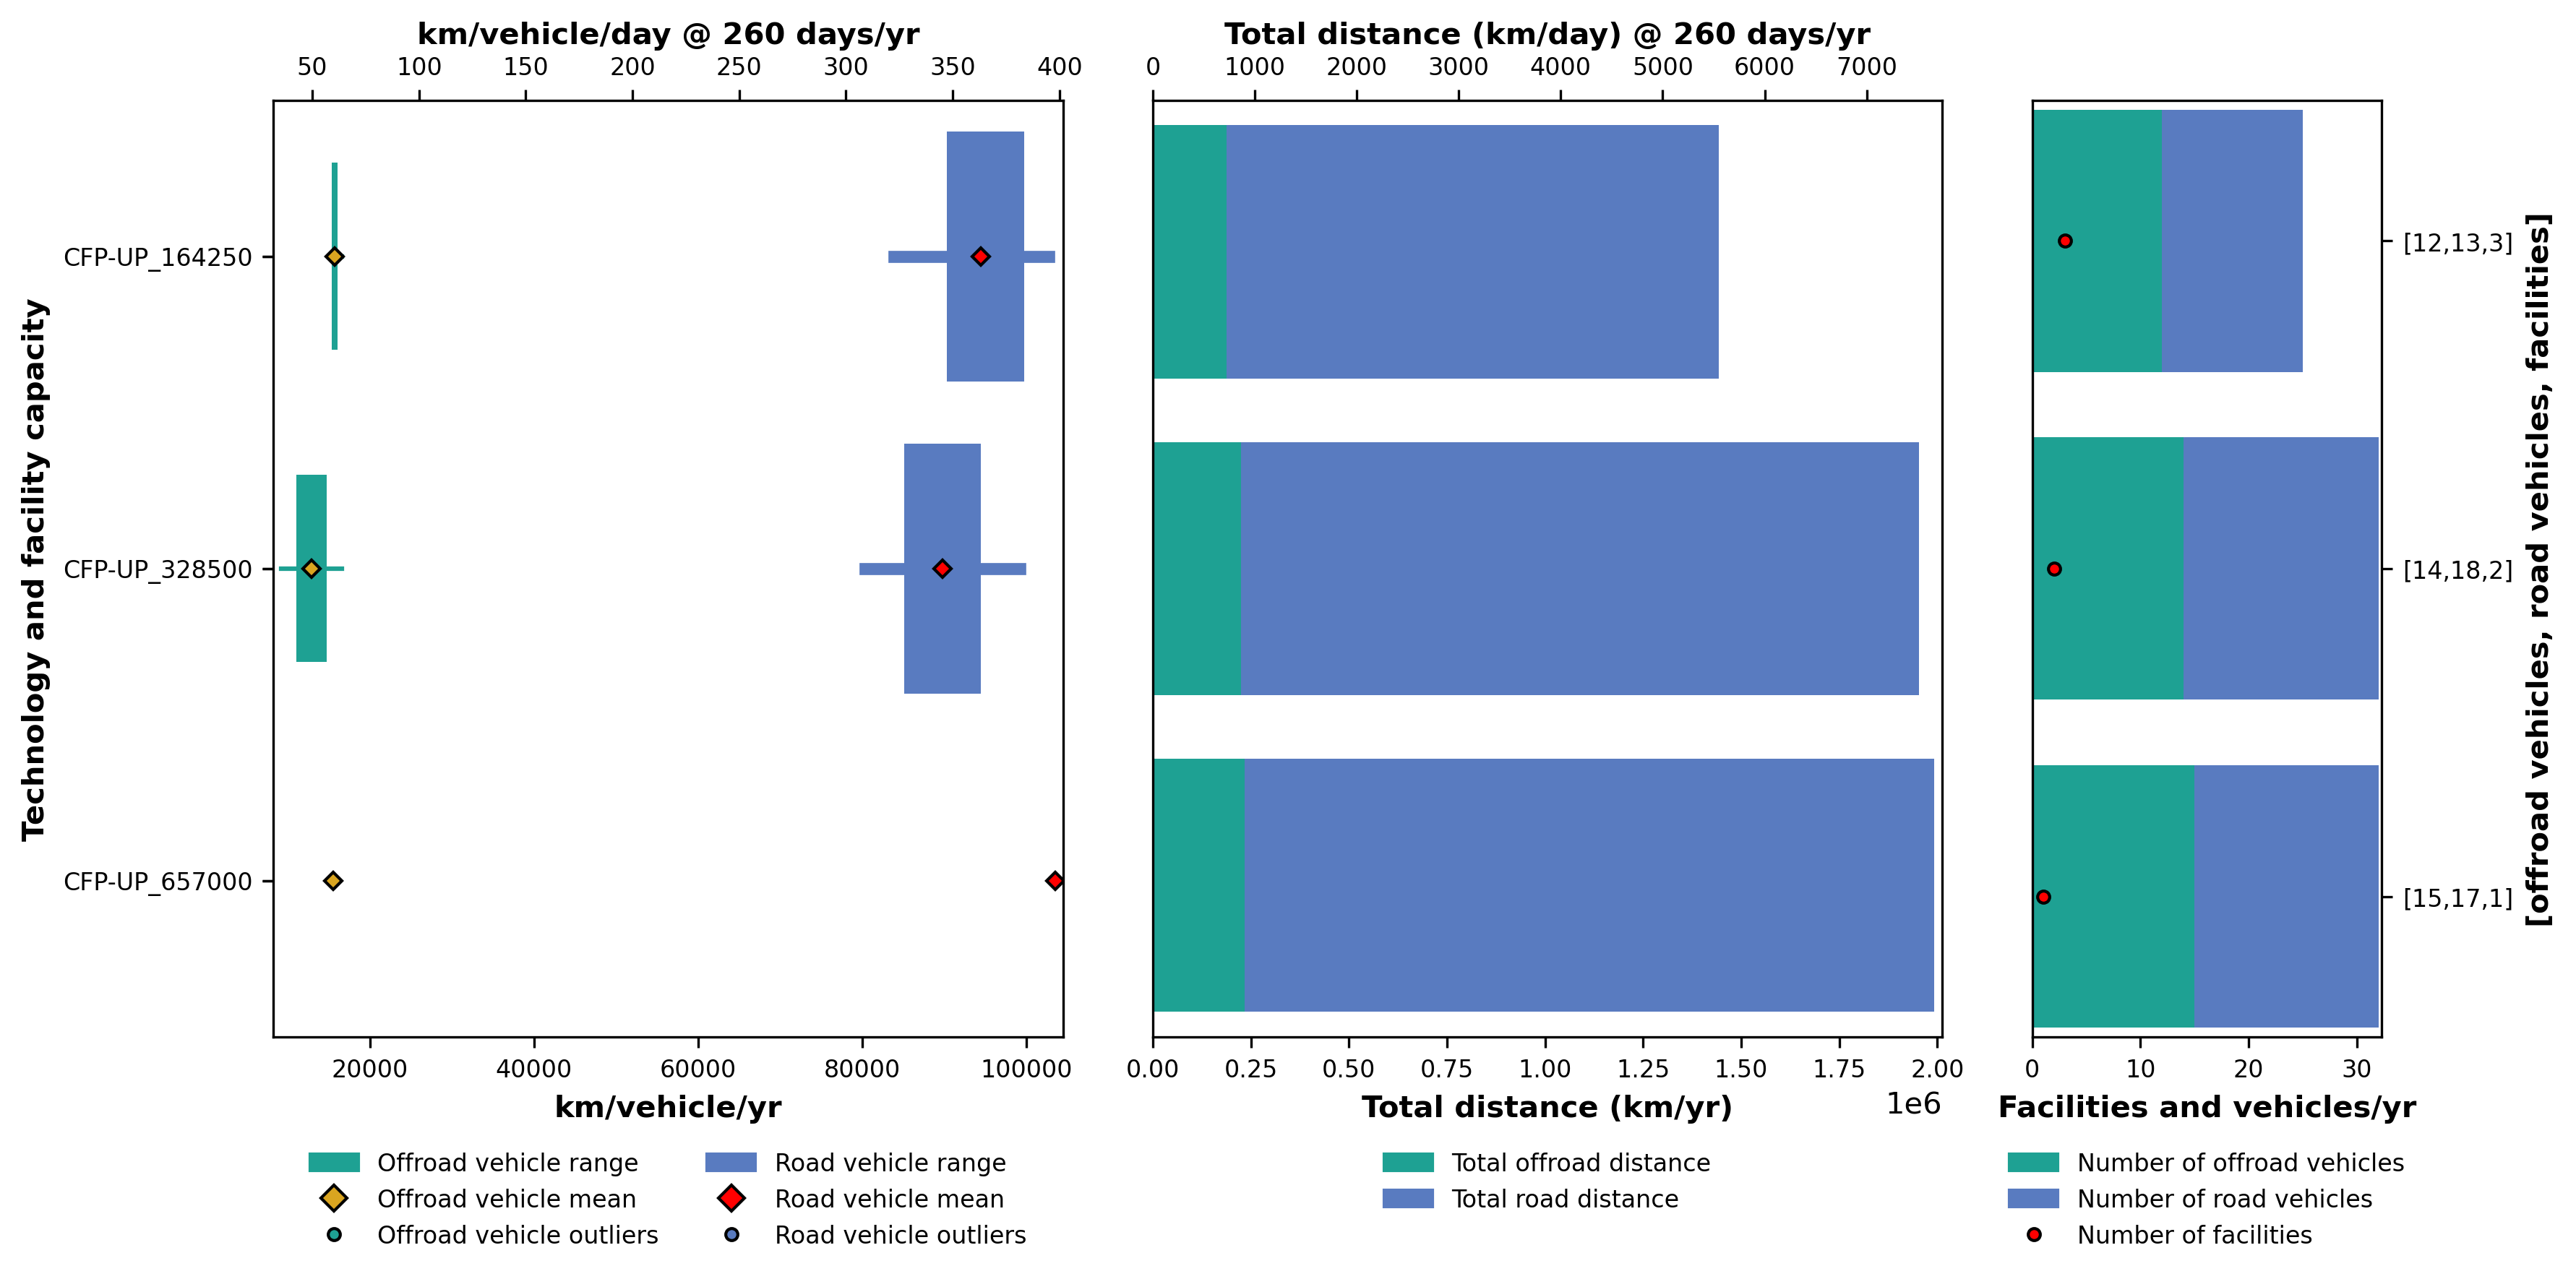
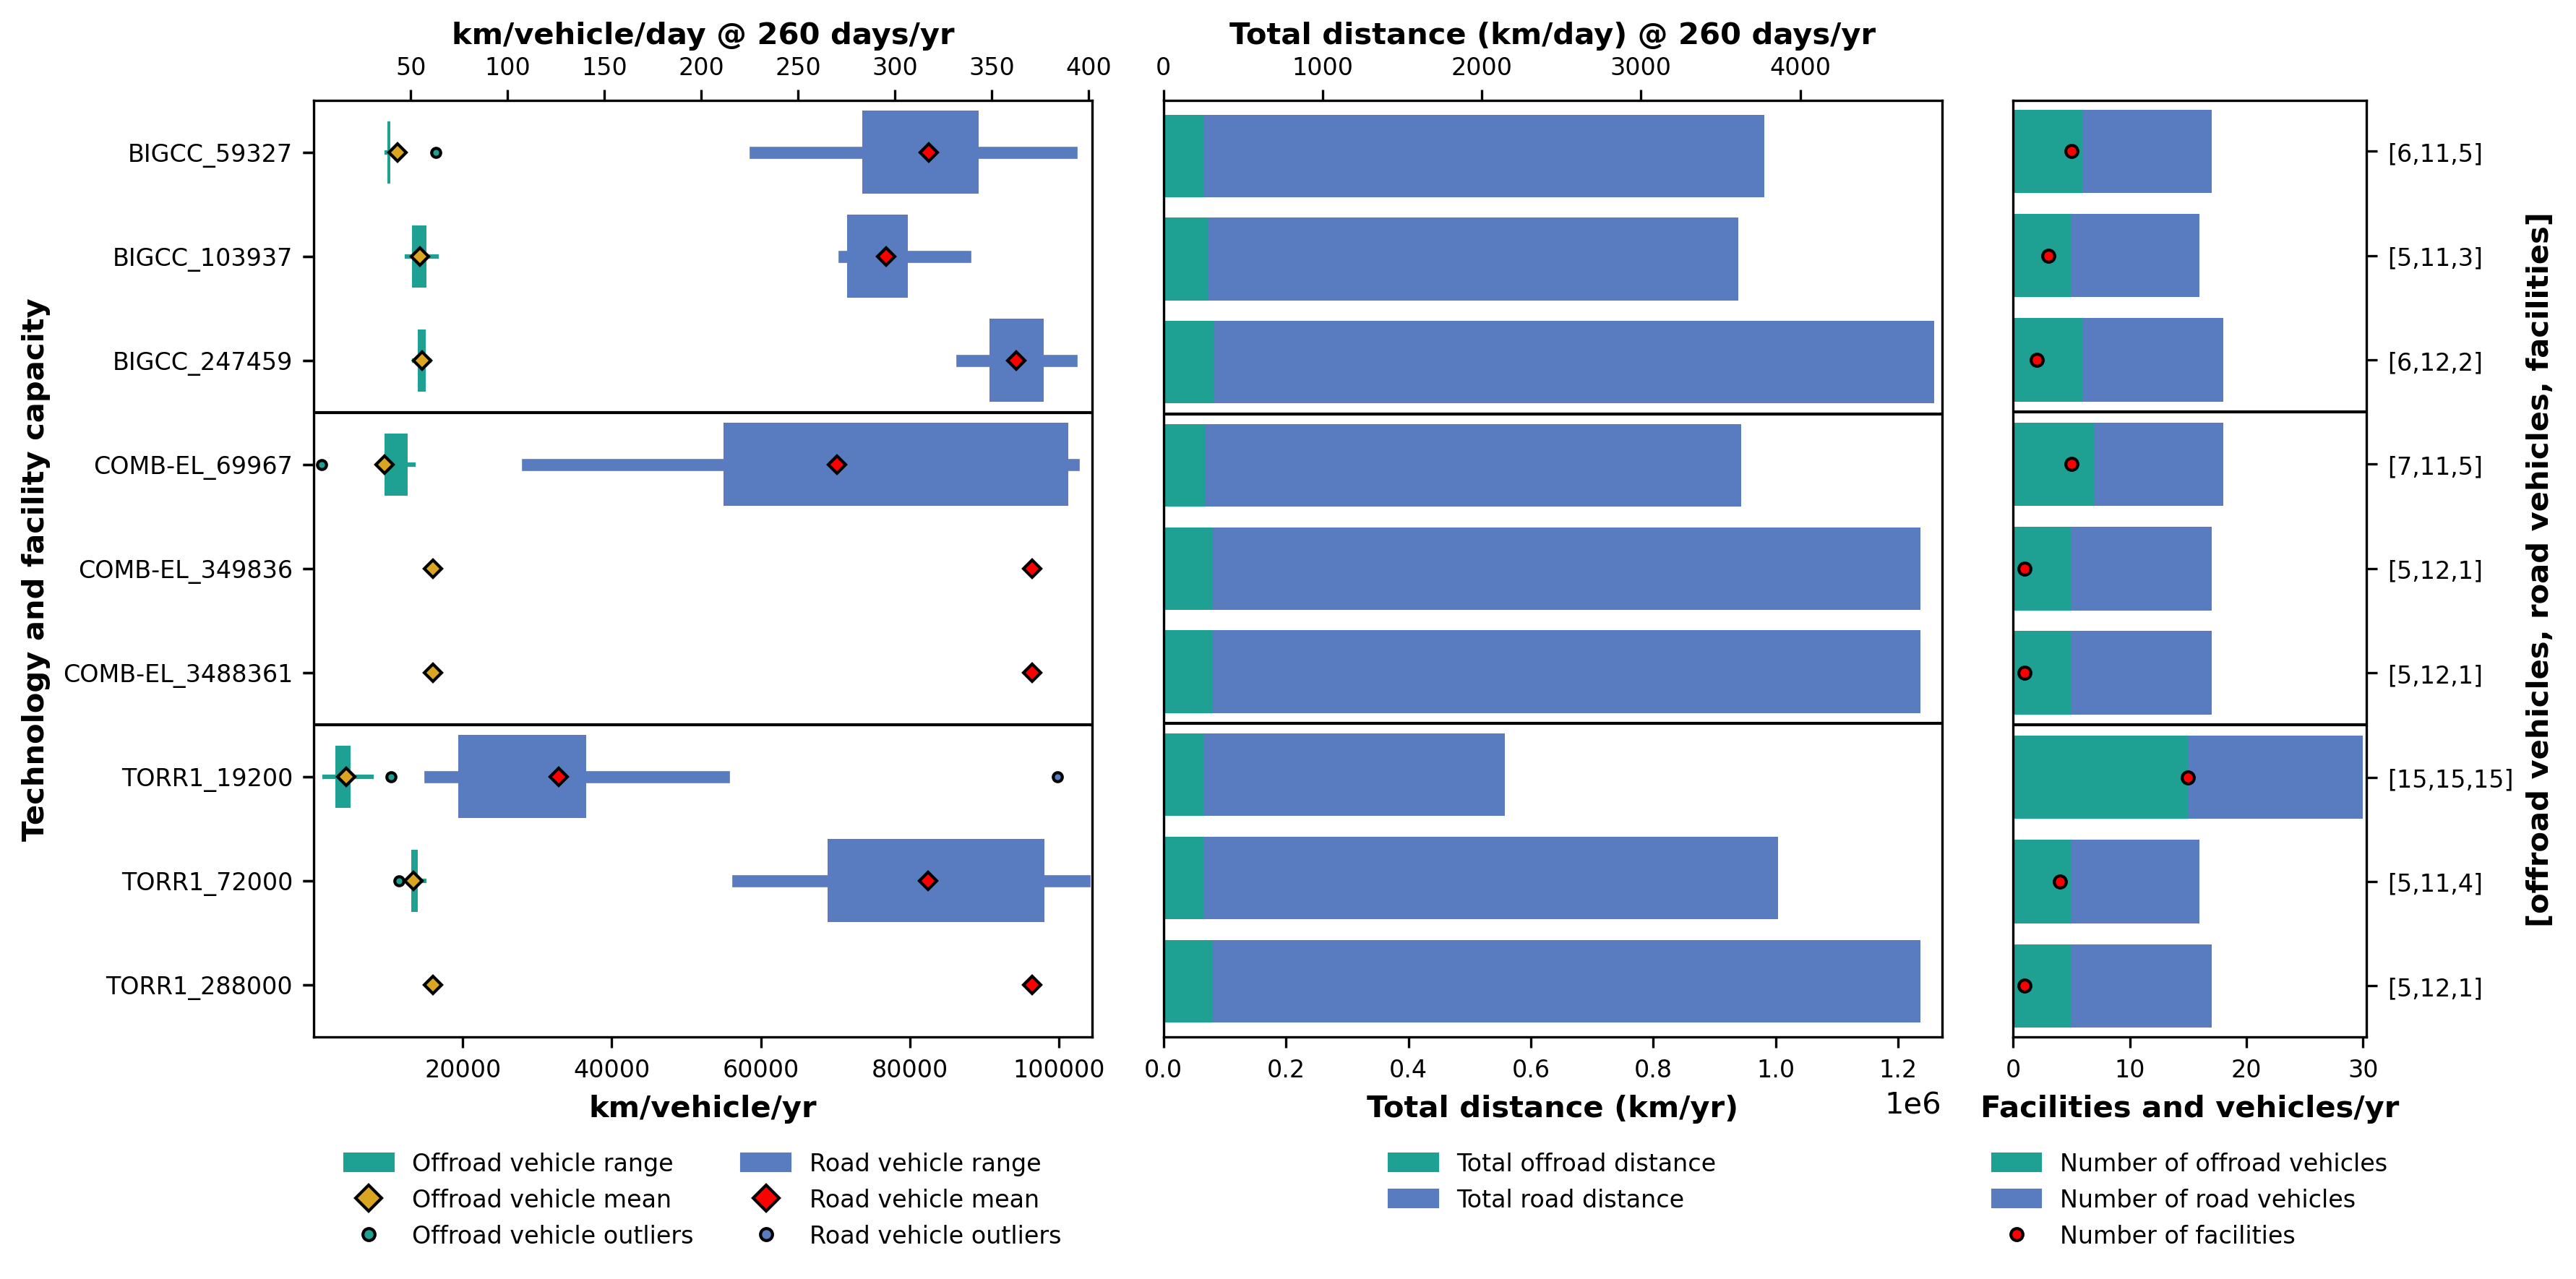
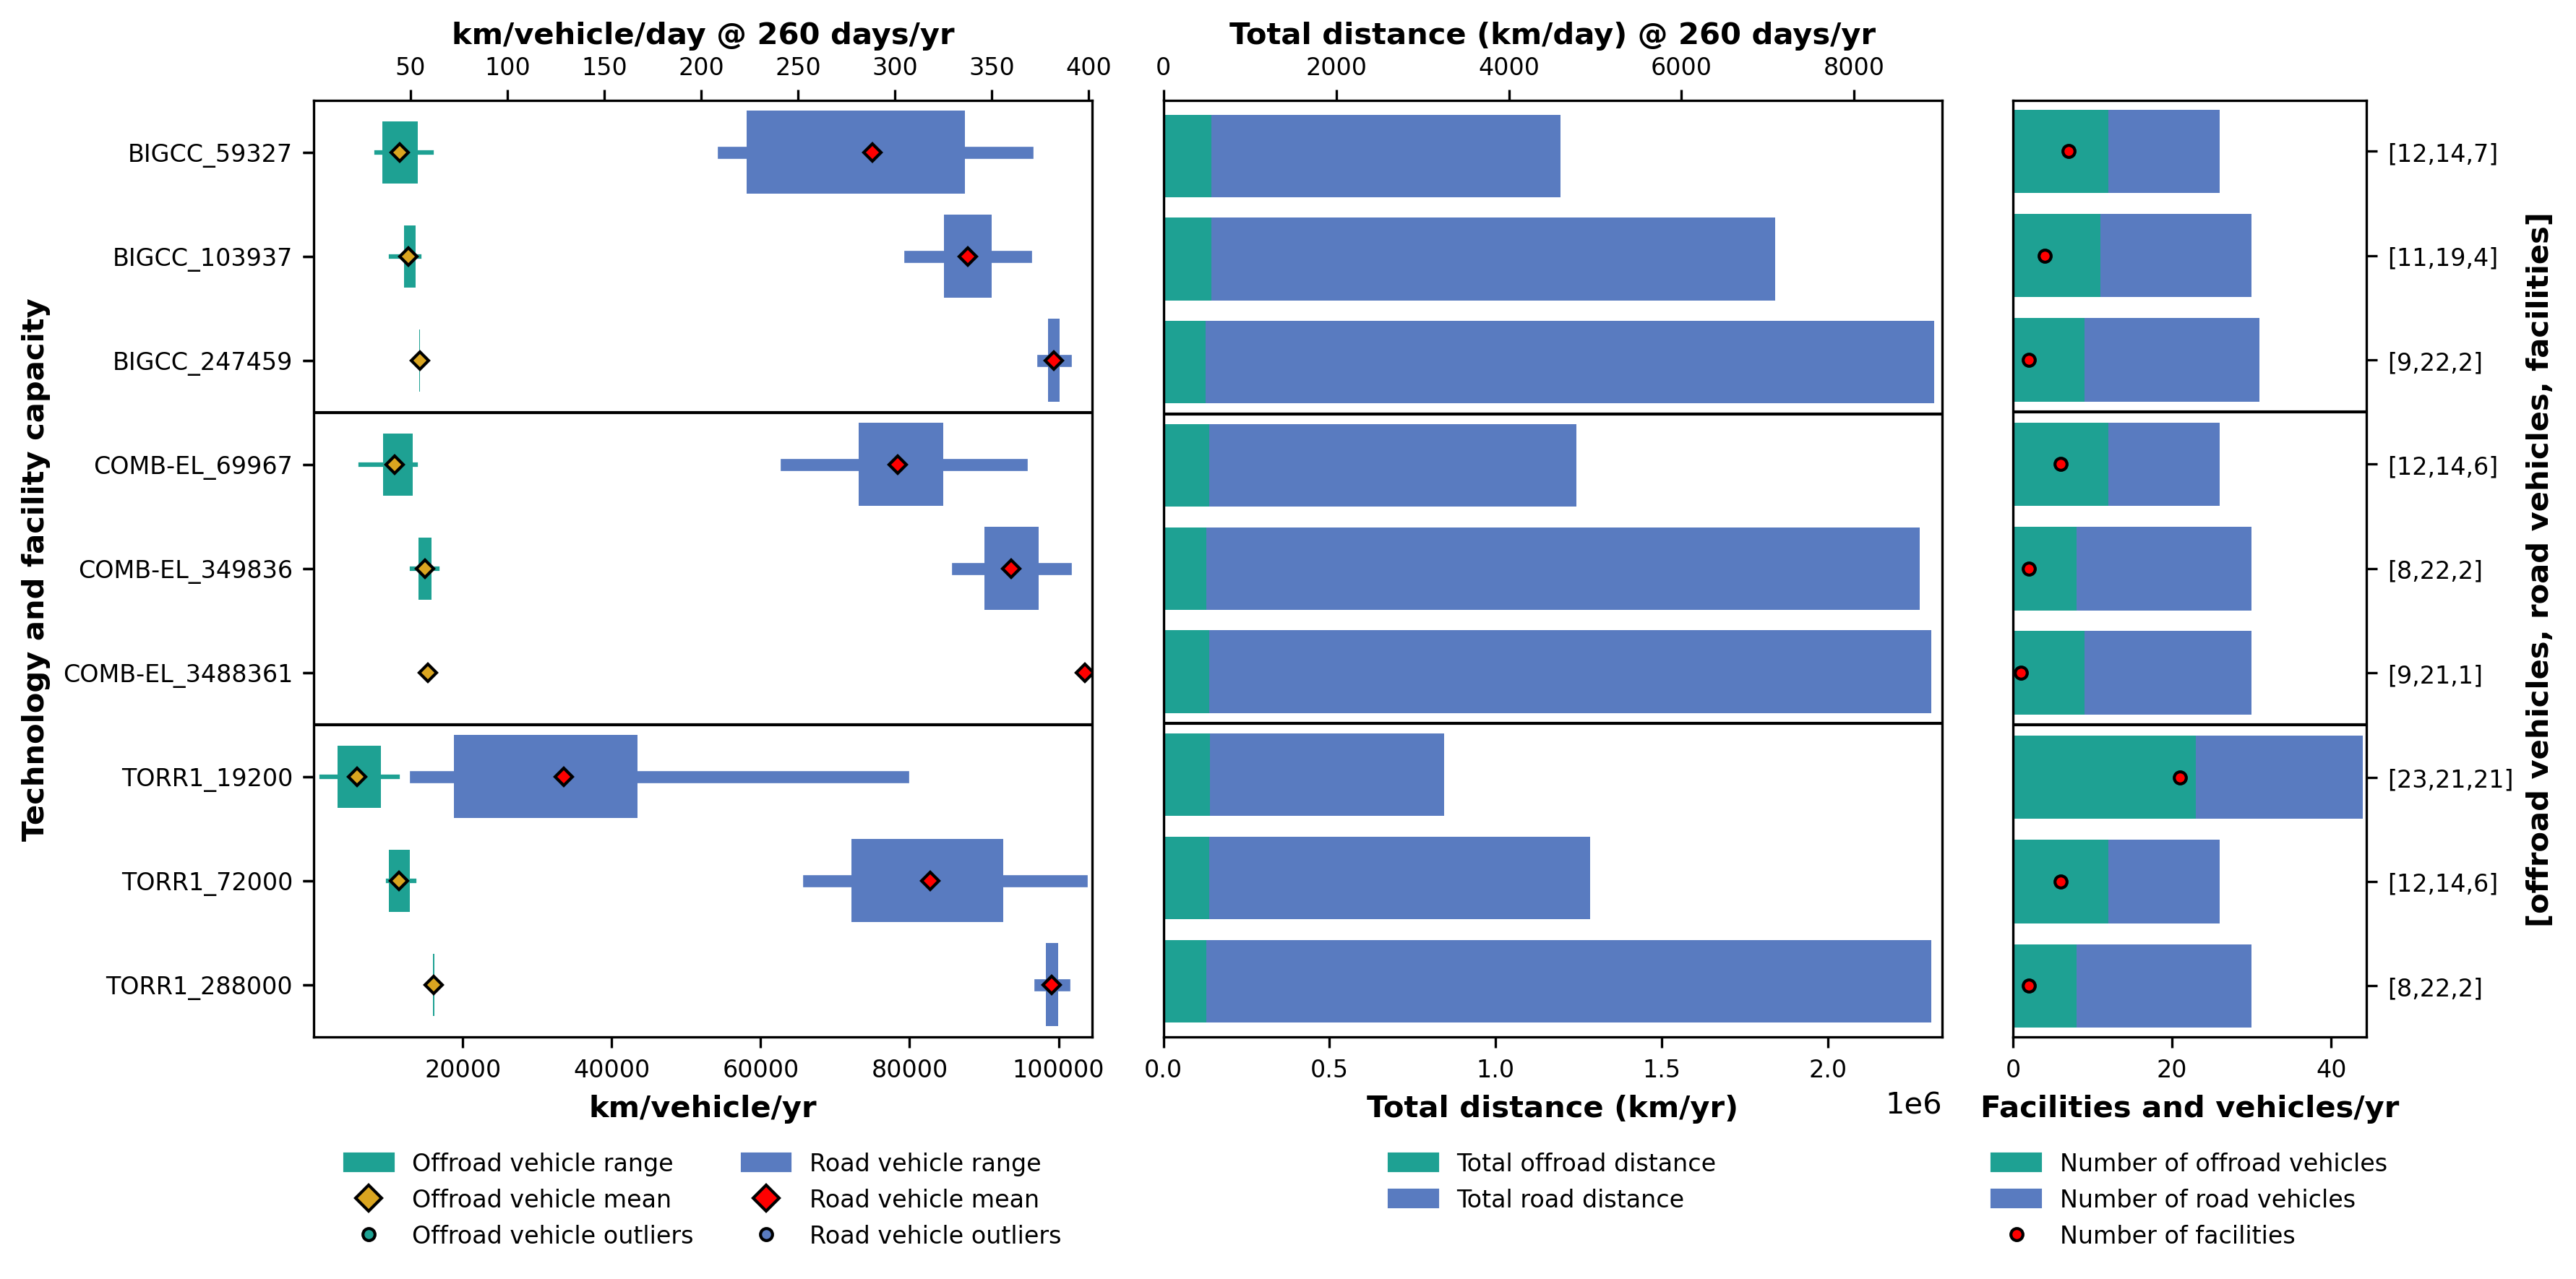
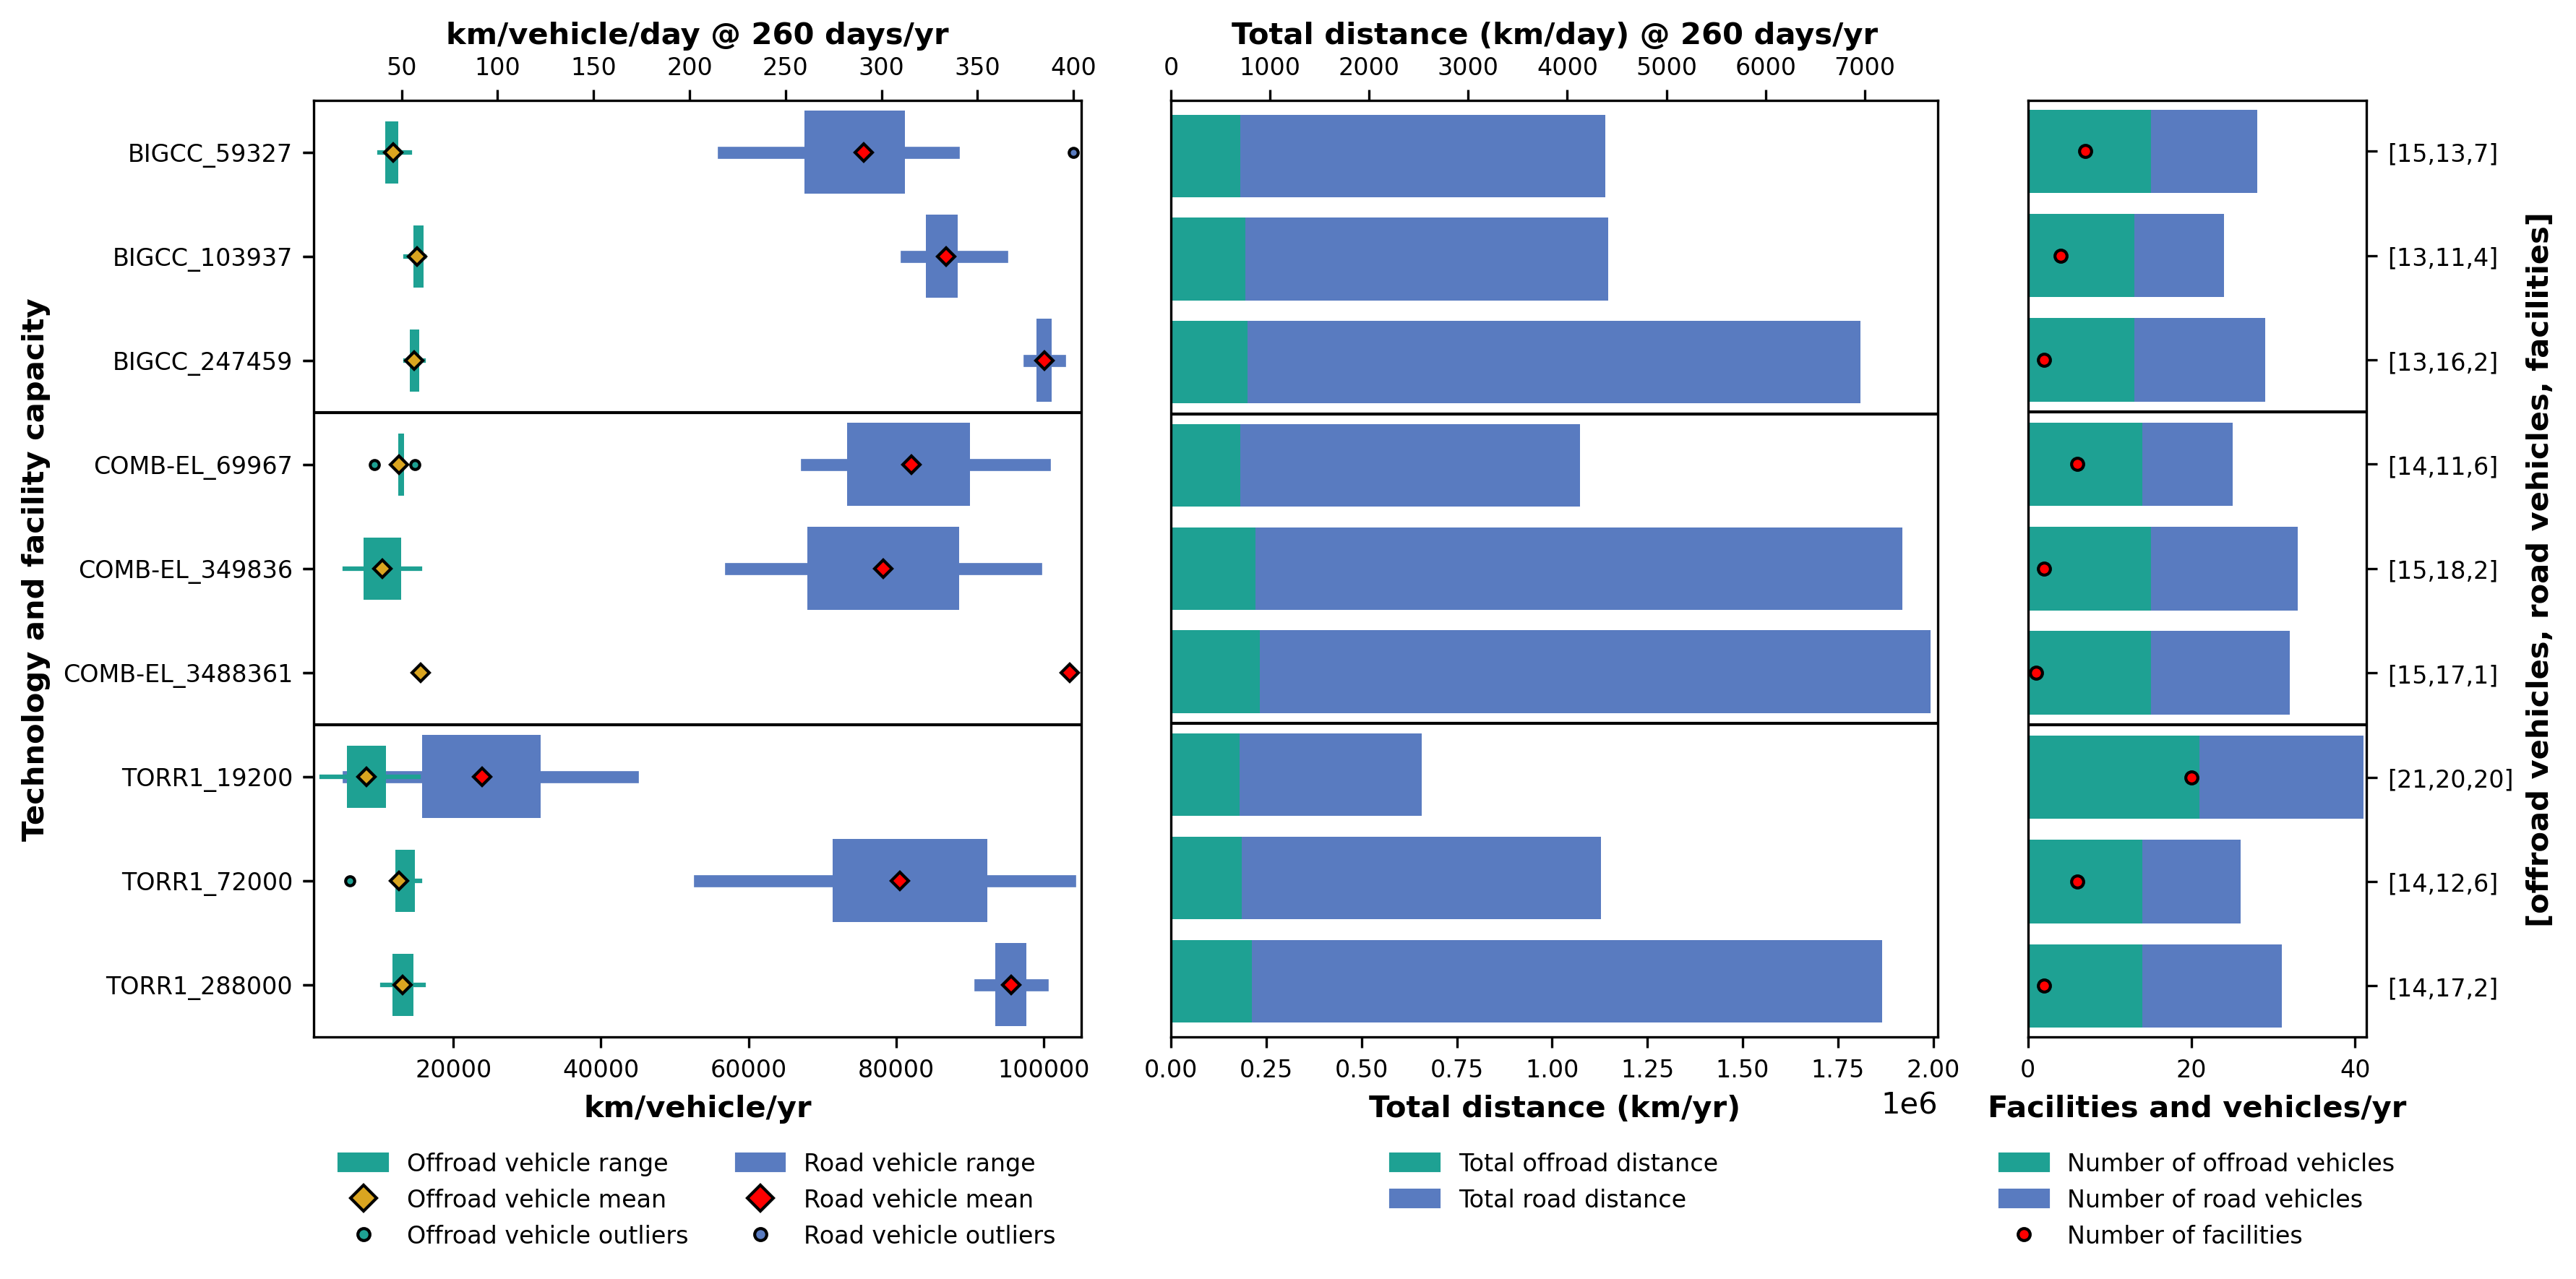
Globally, countries and businesses alike are transitioning towards carbon neutral energy sources and forestry residue has the potential to supply the forestry industry with the energy required for operations, however the volume of forestry residue that is available for harvest sustainably will depend on a combination of site climate, soil and management objectives. Consequently, the BioEnergy Atlas of South Africa commissioned the Institute for Commercial Forestry Research (ICFR) to perform an assessment of the volume of forestry residue that could be sustainably accessed and also develop a suite of decision support tools to aid the forestry industry with assessing the volumes of forestry residue that can be removed from site without impacting site nutrient balances and soil characteristics.

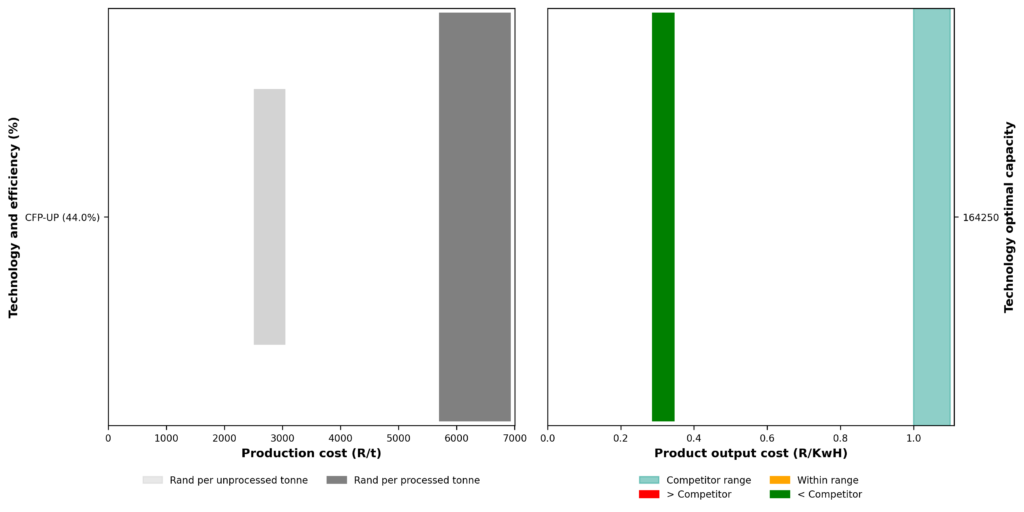
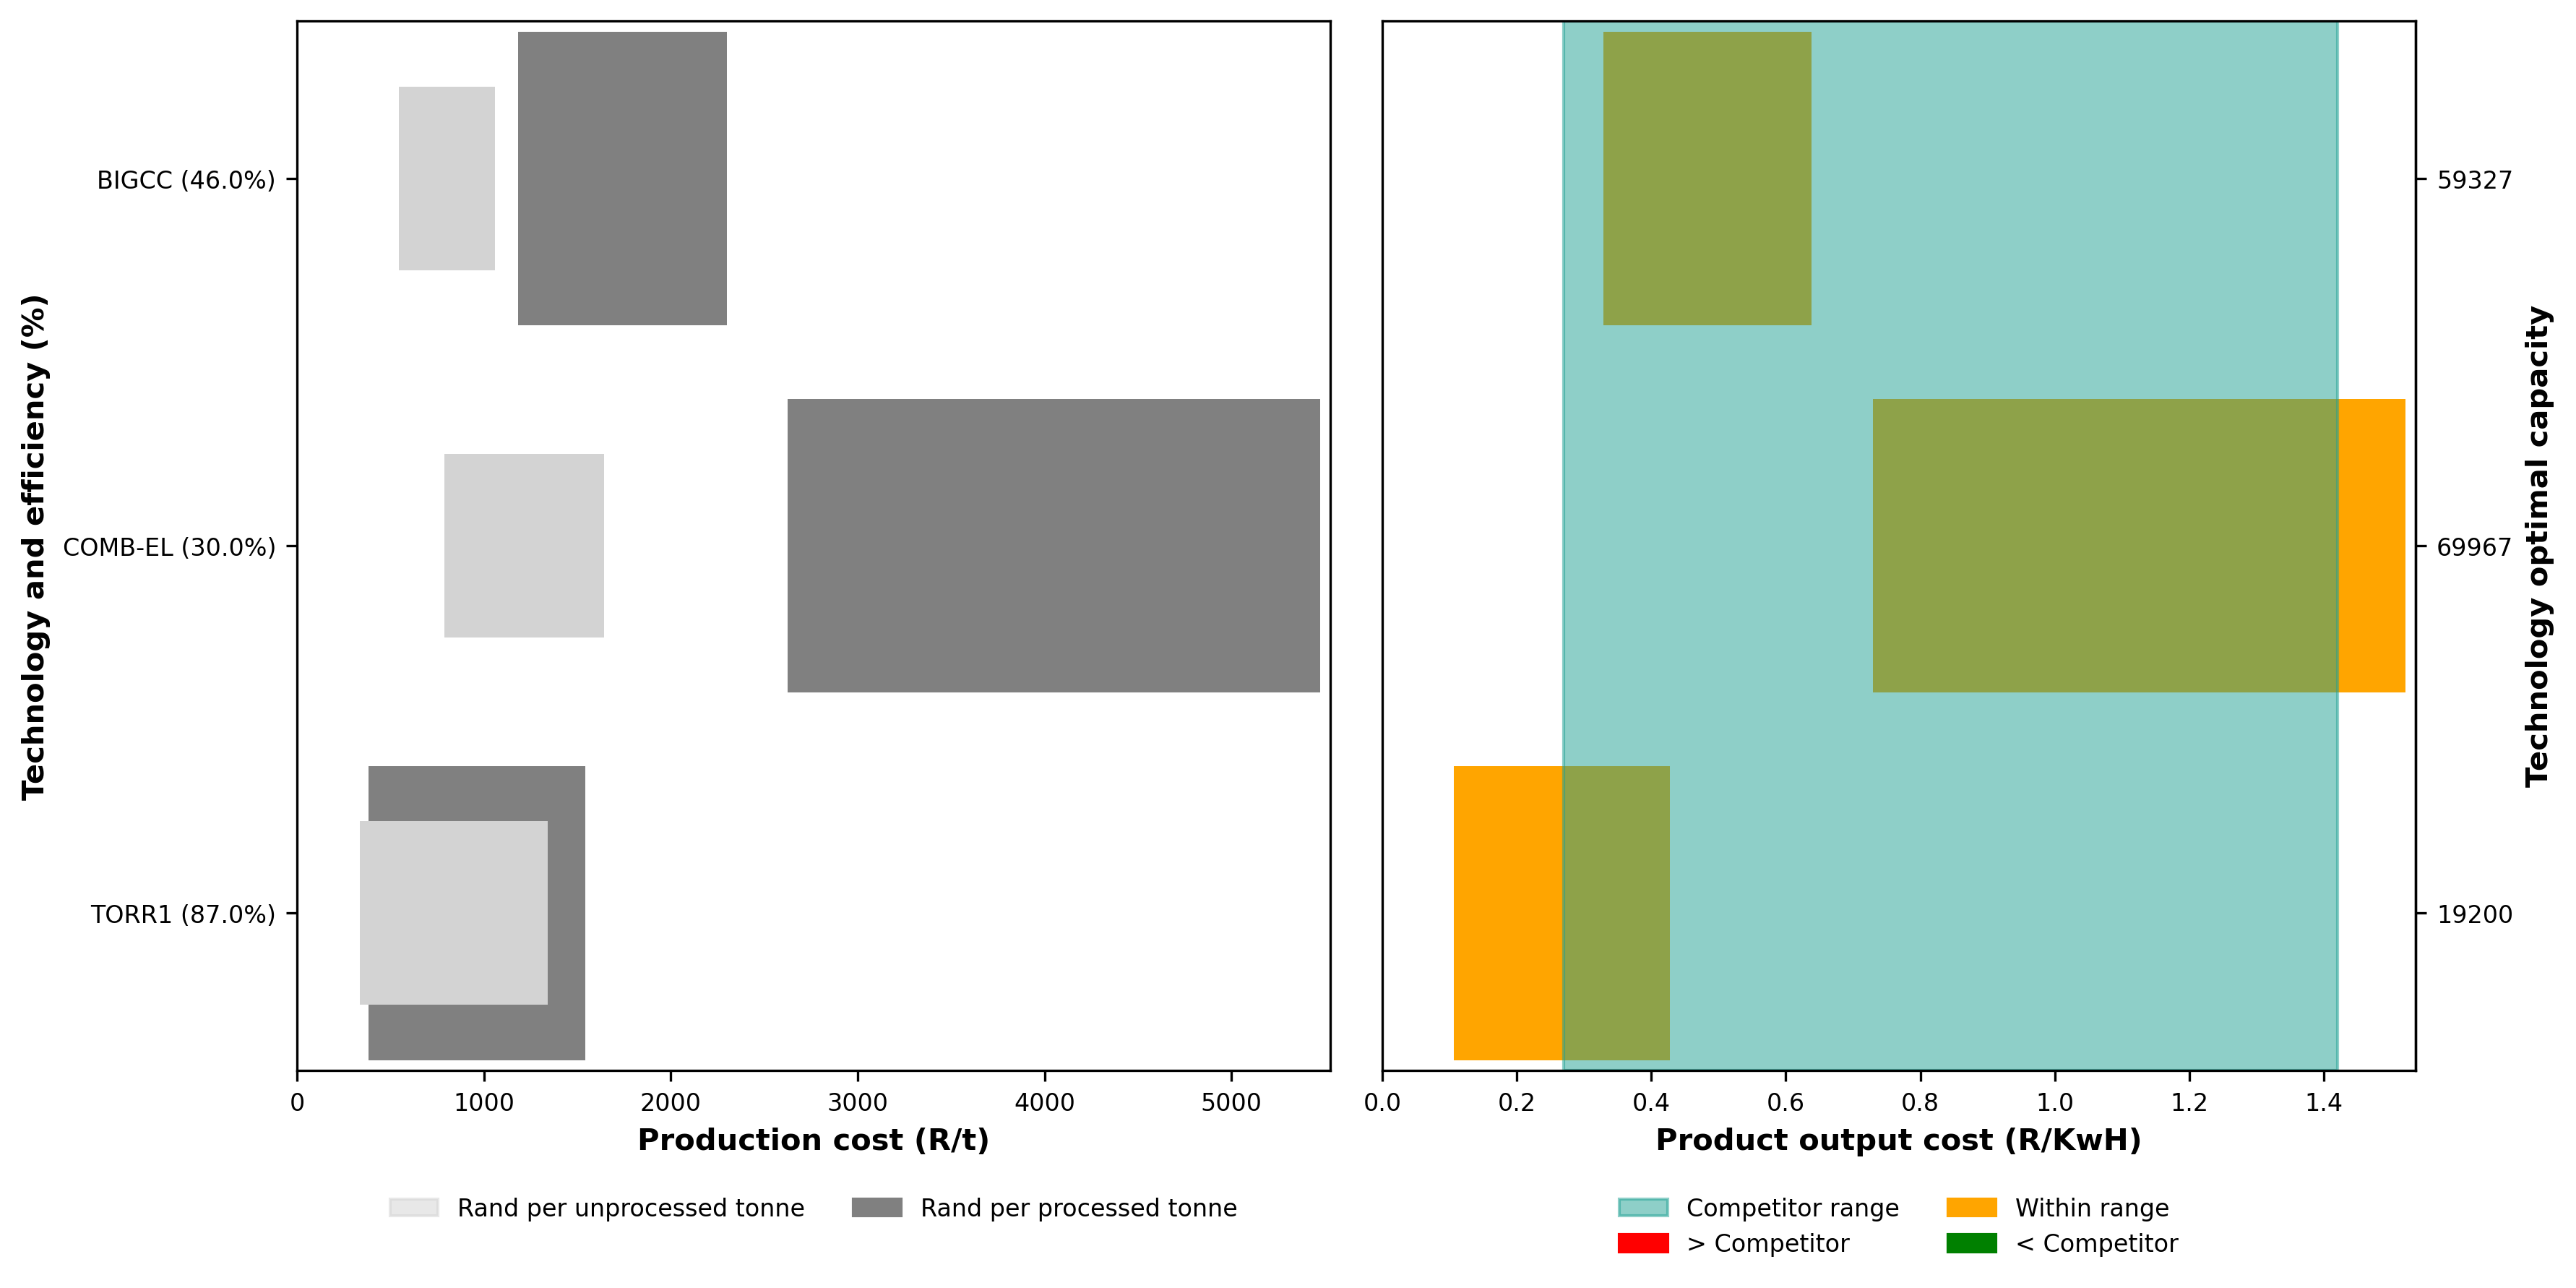
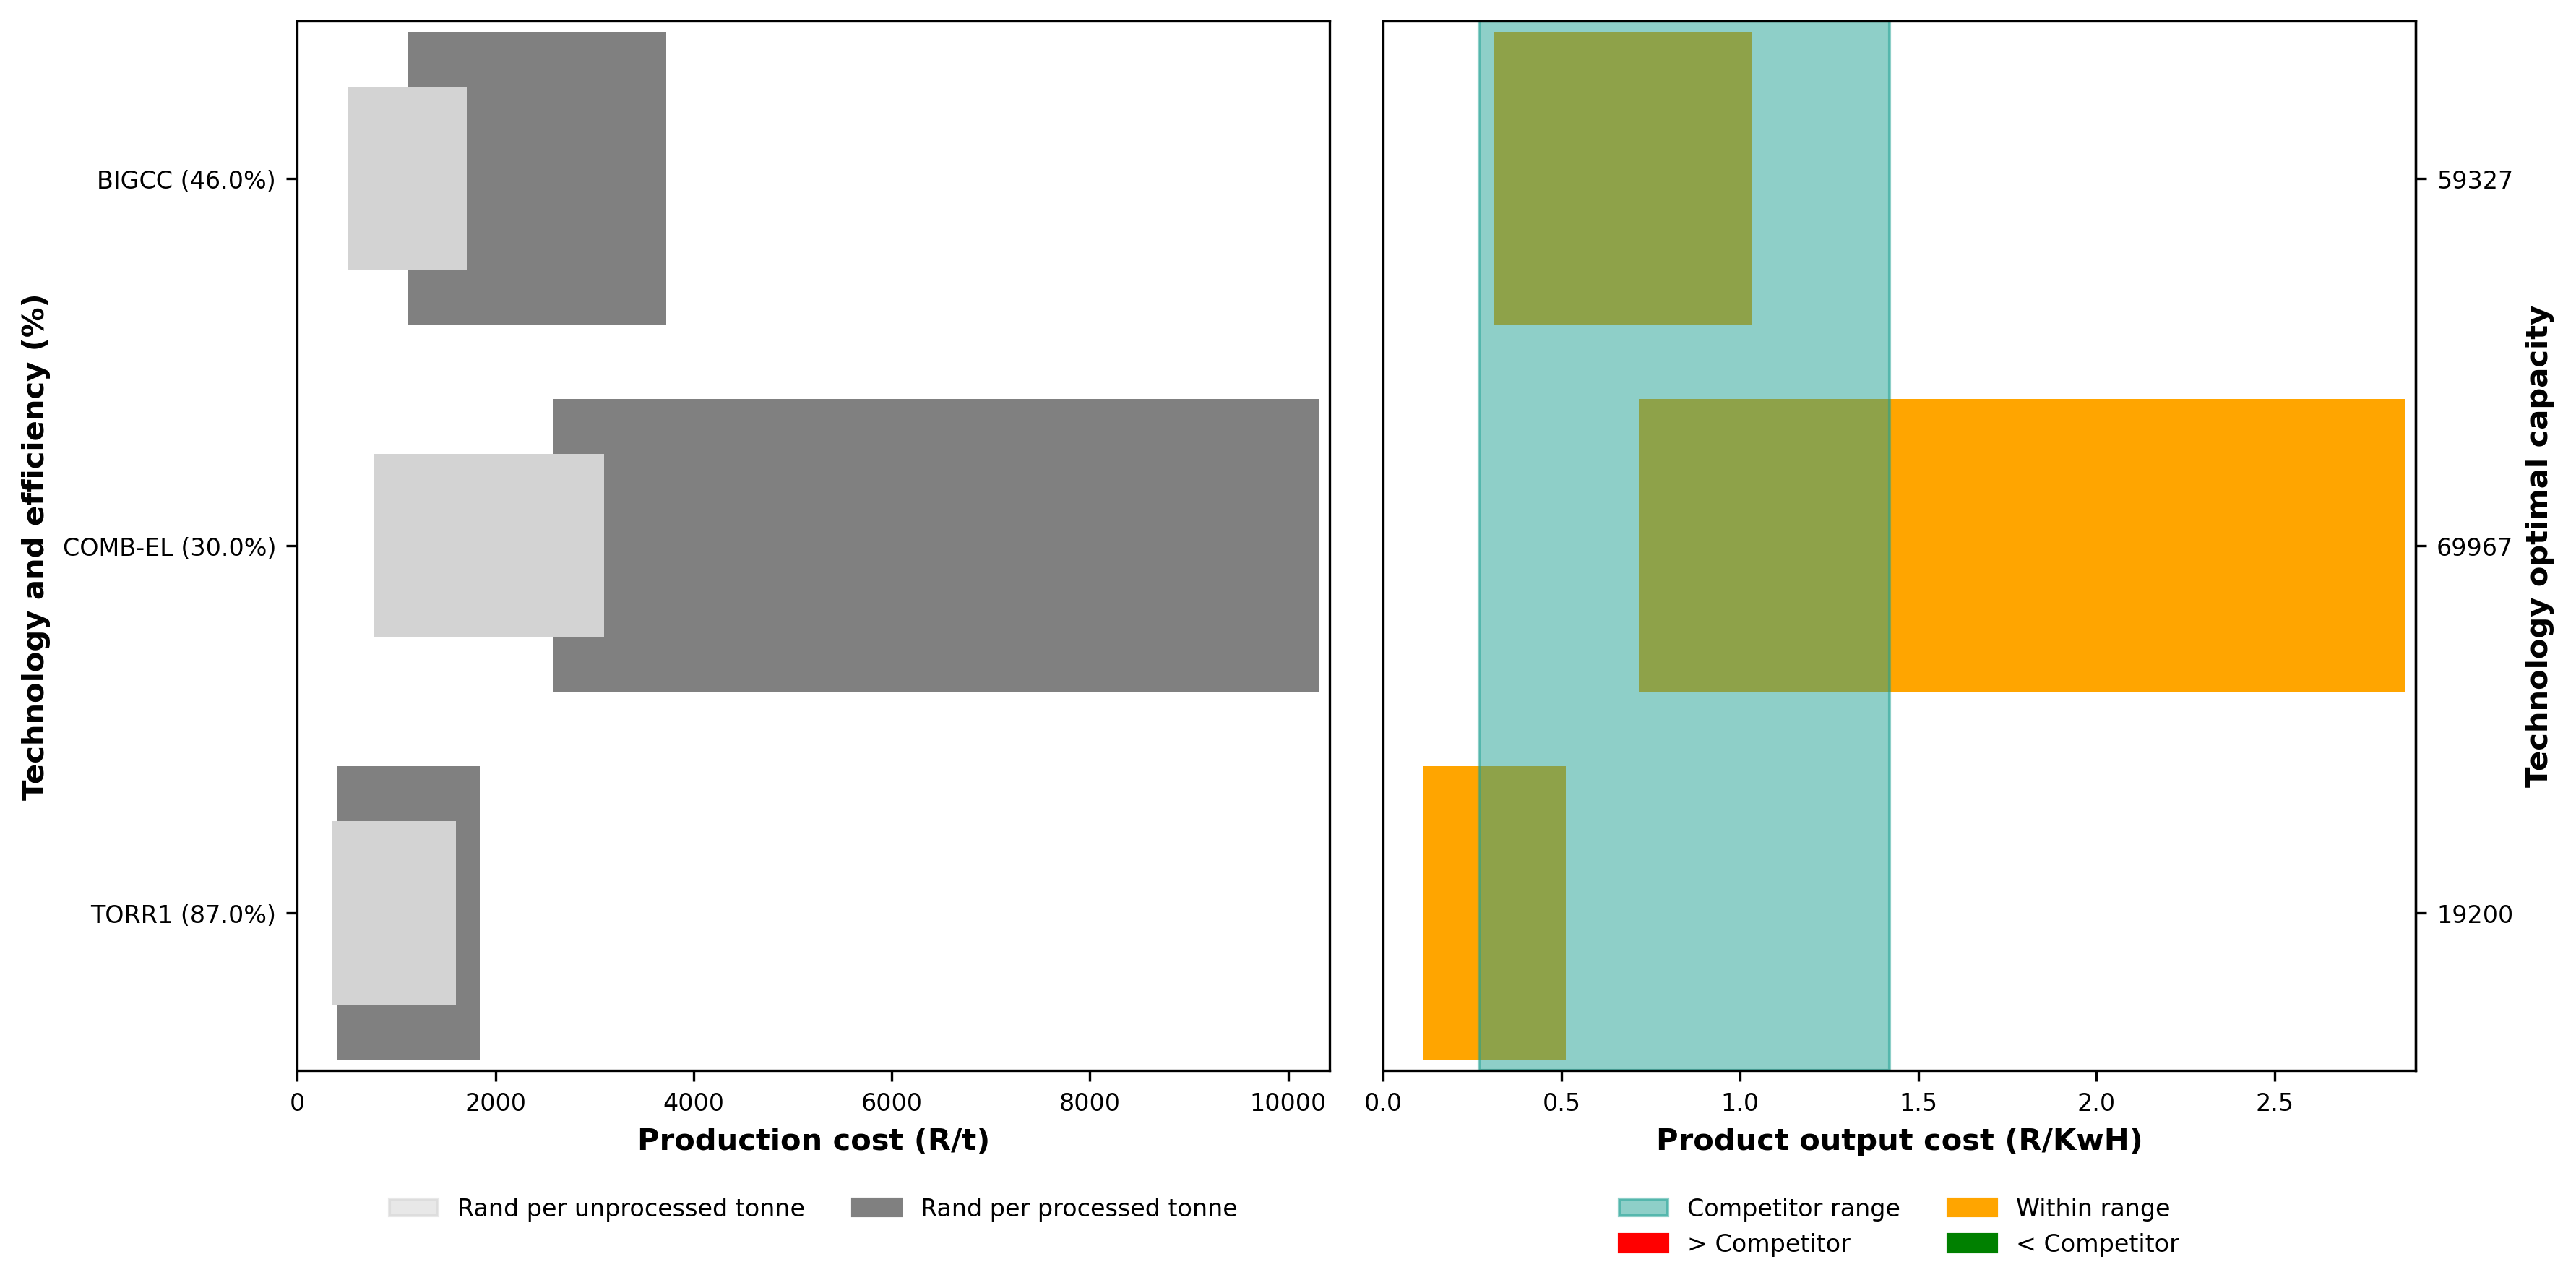
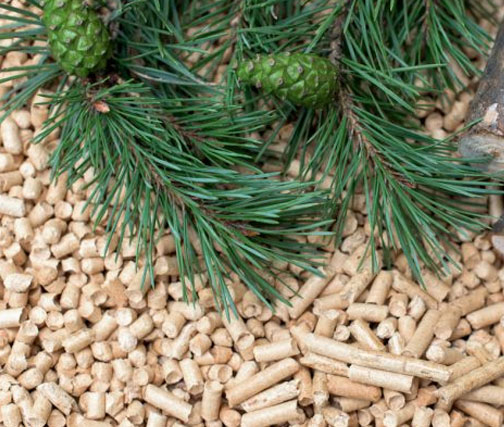
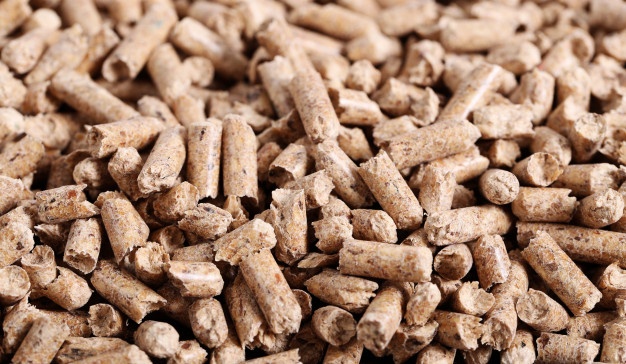
This case study explores the techno-economic feasibility of commercially harvested forestry residue as a prospective bio-resource for generating modern energy products such as wood-pellets, wood-chips, biogas, and electricity from forestry waste. The case study is limited to the major biomass producing regions (viz. Mpumalanga and KwaZulu Natal) and only focuses on the use of forestry residue. The reasoning behind this is that sawmill operations already utilize sawmill waste for cogeneration, while the utilization of forestry residue for energy generation is area of investigation that is under investigated within the South African context. 

Available biomass feedstock

Chart 1: Forestry and Mill Residue availalability (ICFR 2019, Forestry South Africa, 2019)

Forestry Areas Information support

This following dashboard provides information regarding the ownership, timber regime, and timber genus as well as spatial distribution and availability of biomass derived from forestry residue in South Africa. 

Forestry residue to bioenergy

This case study investigating the feasibility of utilising forestry residue for bioenergy production forcuses on the production of biogas, wood chips or pellets and electricity. Biogas and wood chips or pelltets have the potential to be used to replace traditional cooking fuels such as firewood, thus reducing rural communities dependence on fuelwood harvesting. Additionally, there is an increasing demand for wood pellets as a raw feedstock in regions such as Europe and this market can be potentially be satisfied by sustainably sourced and certified biomass derived from forestry operations.

Forest residue to biogas

Biogas is produced when the biomass is anaerobically degraded by micro-organisms. The process of anaerobic digestion (AD) takes place in four steps: hydrolysis, acidogenesis, acetogenesis, and methanogenesis. 

  • During hydrolysis, appropriate strains of hydrolytic bacteria excrete hydrolytic enzymes which break up the insoluble polymers to soluble.
  • These soluble molecules are converted by acidogens to acetic acid and other longer volatile fatty acids, alcohols, carbon dioxide and hydrogen on acidogenesis.
  • The next process is acetogenesis during which, the longer volatile fatty acids and alcohols are oxidized by proton-reducing acetogens to acetic acid and hydrogen. 
  • In the last step of the process, methanogens use acetic acid or carbon dioxide and hydrogen, to produce methane and carbon dioxide.

Biomass Pretreatment for Enhancement of Biogas Production

Biogas competitor prices

Forest residue to wood chips or pellets

Typically, woody biomass by-products such as wood chips, pellets, sawdust, and briquettes are combusted or gasified to generate electricity.

  • Chipping– Chipping can be carried out at a large variety of scales from roadside chipping using a small tractor powered chipper up to large scale fixed site chipping factories. When chipping is carried out at the road this cost is often considered as part of the harvest costs. 
    road this cost is often considered as part of the harvest costs.
  • Pelleting– The pelleting process is used to densify the energy contained in lignocellulosic biomass. Pellets are formed by extruding the biomass through a due using a screw extruder or a piston press. During pelleting the biomass is heated (conditioned), which melts the lignin found in the wood which acts as binder. The resulting product is generally known as pellets or briquettes depending on the size of the product formed. Any type of lignocellulosic biomass including the organic fraction of municipal solid waste can be used to make pellets. 

Forest residue to electricity

Typically, woody biomass by-products such as wood chips, pellets, sawdust, and briquettes are combusted or gasified to generate electricity.

  • Combustion– Most bio-powered plants use directly fired combustion systems. They burn biomass directly to produce high-pressure steam that drives the turbine generator to generate electricity.
  • Gasification– Gasification involves heat, steam, and oxygen to convert biomass to hydrogen and other products. Developing technologies gasify the biomass to produce a combustible gas.


The following technologies were run during the techno-economic feasibility analysis process.

Conversion technology Feedstock Bioenergy output
CBP-Pelleting
pellets or briquettes
CFP-UP
biogas, bio-oil and char
COMB-EL
Electicity
BIGCC
Electricity
TORR-1
Electricity
CBP-Chipping
wood chips

Techno-economic feasibility analysis

The techno-economic feasibility analysis for this case study determined optimal locations in Kwa-Zulu Natal and Mpumalanga province to place bioenergy-producing facilities. The site allocation of the facility is based on the distribution and volumes of available feedstock. A conservative estimate of 25% of available forestry residue was used in the techno-economic feasibility analysis, however there is potentially more biomass available for exploitation, however this will need to be assessed on a site by site basis using the management tools developed by the ICFR and will storngly depend on the managment objectives, climate and soil characteristics of the site.Links to the decision support toosl and data are included below:

The modeling process consisted of generating service regions for candidate facility locations, followed by ranking the sites based on the relative transport costs required for each candidate facility. Data regarding the number of facilities and the transport costs and distances per modeled facility location are presented below as cost summaries, transport distances, and facility spatial information.

Cost comparison per facility type

Comparisons of the unit cost of production for each technology and facility capacity used in this case study are presented below. A comparison between processing facility product output (biogas, wood pellets, woodchips and electricity) is shown between the three different locations (Midlands, Mpumalanga north, and Mpumalanga south). In each category tab, a unit cost of production is given per harvested tonne and processed tonne (left), and the corresponding cost/unit output (right) and the competitor range. All values are given in  Rand equivalents. The competitor prices for biogas come from the Green Cape biogas business case study, and competitor prices for electricity are from ESKOM’s 2017/2018 South African Energy prices statistics document . 

In each figure, production costs (left) are the total costs estimated from the model and include the Capex and Opex of the conversion facility, as well as the transport costs and loading costs from feedstock locations to conversion facility (a more detailed costing of each category is given further down). Here, the production cost per processed tonne is dependent on the conversion efficiency of the processing technology (shown on the right-hand axis in the top row). The top row provides a more detailed comparison, while a range summary (per technology) is presented below.

In general, the product output cost of biogas in all three regions is below the competitors range. For electricity, the general sense in all three biomass producing locations indicate that forestry residue biomass is either within the competitors range or below the range. The same is identical for wood pellets and wood chips. According to all four bio-resources modelled, the cost of producing electricity and biogas from the above mentioned conversion technologies is lower if not within range of the competitor. Which makes it feasible to implement bioenergy production from these three optimal  locations using forest residues. 

1. Midlands

2. Mpumalanga south

3. Mpumalanga north

  1. Midlands
  2. Mpumalanga south
  3. Mpumalanga north
  1. Midlands
  2. Mpumalanga south
  3. Mpumalanga north

1. Midlands

2. Mpumalanga south

3. Mpumalanga north

Cost summaries per facility type

The charts below present detailed production costs for each conversion technology according to various cost categories (Capex, Opex, load costs, unloading costs, and transportation costs). The charts also present the costs per scenario (lifetime, average, and present value in 2019 Rands) in the top row and per facility in the bottom row. The total Rand value is given on the right-hand axis of each chart, with the cheapest production cost highlighted in bold.

Midlands

Mpumalanga south

Mpumalanga north


Transport summaries per facility type

The transportation summaries below give details on the transportation requirements for each conversion technology. On the left are the ranges of distances required for each facility and transport mode (road and off-road). The mean distances per working day and year (per vehicle) are given. The total distances (for all vehicles) are summarised in the middle chart. Finally, the chart on the right provides the number of vehicles and facilities (these values are presented on the right-hand axis) for each conversion technology.

  1. Midlands
  2. Mpumalanga south
  3. Mpumalanga north
  1. Midlands
  2. Mpumalanga south
  3. Mpumalanga north
  1. Midlands
  2. Mpumalanga south
  3. Mpumalanga north
  1. Midlands
  2. Mpumalanga south
  3. Mpumalanga north

Transport distances and facility spatial information

The figures below present a detailed summary of the transportation distances for each of the conversion technologies used in this case study, along with the location and routes from each feedstock location (including their catchment area) to the conversion facilities in each technology option. The road type attributes in the bar chart (top) are according to the attribute fields in South Africa’s National Geo-spatial Information (NGI) 2019 road layer (http://www.ngi.gov.za). The distances are given per road type in km/y and summarised as the total road, total off-road, and total distances that need to be travelled. Additional information and model assumptions are provided in the bottom image. These include the feedstock type; the total tonnes available from the feedstock per year (the minimum); the conversion technology and its processing capacity; the total distance that needs to be travelled; the number of road and off-road vehicles required (including assumptions about their cost per km, average travel speed, load capacity, and working days per year). The legend on the map provides further information on the number of facilities required for each scenario, the number of feedstock locations (roadside depots), and the number of catchments that supply the feedstock.

Midlands

Mpumalanga south

Mpumalanga north

Conclusions

The spatial logistical modeling platform developed for the BioEnergy Atlas of South Africa was utilized to develop scenarios for locations where bioenergy-producing facilities can be built. Model outputs include spatial logistical information such as optimal biomass transportation routes from the biomass location to the modelled facility locations as well as cost summaries which include Capex, Opex and Transport costs. The modelled cost for each proposed facility location are compared to existing product market prices, allowing the price competitiveness for each location to be determined.

Model outputs show that the production cost (R/tonne) was below the competitor range for producing biogas and electricity from forest residue. All conversion technologies production costs (R/t) were within the competitor range or below. .  Another important thing to note is that all processing technologies with small capacities have a lower rand value in terms of all operational and transport costs.Therefore, this case study proves that the volume of biomass feedstock available annually is sufficient to supply bioenergy production facilities in all three of our study locations

Data

Feedstock spatial information

Download the spatial information for forest residue feedstock

Download feedstock spatial data

Feasibility Analysis Results

Download the results from the feasibility analysis

Download model outputs

Resources

Bibliography

  1. Department of energy. South African energy prices statistics (2018), viewed 27 October 2021. <http://www.energy.gov.za/files/media/explained/2018-South-African-Energy-Prices-Statistics.pdf>
  2. Fike, J. H., Parrish, D. J., Wolf, D. D., Balasko, J. A., Green, J. T., Rasnake, M., & Reynolds, J. H. (2006). Long‐term yield potential of switchgrass‐for‐biofuel systems. Biomass & Bioenergy, 30, 198– 206.
    <https://doi.org/10.1016/j.biombioe.2005.10.00/>
  3. Forestry South Africa (FSA), Representing the forestry industry, viewed 27 October 2021, <https://www.forestrysouthafrica.co.za/>.
  4. Green-Cape. The business case for biogas from solid waste in the Western Cape. viewed 27 October 2021, <https://www.greencape.co.za/assets/Uploads/GreenCape-Biogas-Business-Case-Final.pdf>
  5. Karuppiah T & Azariah V,A. Biomass pretreatment for enhancement of biogas production. <https://www.intechopen.com/chapters/65202 >
  6. Kotze H, Kassier HW, Fletcher Y, Morley T. Growth modelling and yield tables. In “South African Forestry Handbook”, Bredenkamp BV and Upfold SJ (eds). 2018. 5th Edition. The Southern African Institute of Forestry, Pretoria, South Africa.  175-209.
  7. Whole building design, Biomass for electricity (U.S. Department of Energy Federal Energy Management Program (FEMP), viewed 27 October 2021,<https://www.wbdg.org/resources/biomass-electricity-generation>